
The Data Toolbox empowers you to construct a multistep ETL process for maximizing the value of your data
Table of contents
Create a Data Toolbox pipeline
Go to Analysis >Access the Data Toolbox
You will find the list of all existing pipelines. Use the search box to find your desired pipeline.
-
Click on the + button to create a new pipeline.
-
Enter a name for your pipeline and select the data structure needed, then click on Confirm.
-
Start by adding the stages to get the desired results. To do this, drag and drop a stage and complete the needed details. Please refer to this section to learn more about all the supported stages.
-
To preview the result of each stage, you have the option to click on Preview. The pipeline will randomly select 150 records and run the pipeline on them, allowing you to see the outcome of the stage.
-
To revert the changes, click on the trash button.
-
Click on the Save button to save the pipeline.
Supported stages
- Group: Group the data based on any combination of fields and define associated aggregated fields.
- Filter: Filter the results of the previous stages.
- Sort: Sort the data in any order based on any combination of fields.
- Limit: Limit the result set to a specific number of records. (for example, limit=10, to get only the first 10 records)
- Add Conditional Field: Define a new field based on certain conditions.
- Flatten Array: Transform the array components into fields that can be projected and returned.
- Uncorrelated Pipeline: Define a new field based on the result of an uncorrelated pipeline.
- Arithmetic Formula: Run arithmetic calculations, safely, straight on your data using math formulas.
- Previous Value: Store the field values of the preceding record based on a particular sorting rule.
- Cross Product: Generate the cartesian product of two arrays and generate useful subvalues.
- Replace Root Field: Replace the root document with an array field.
- Project: Select only the fields of interest from the data (for example: I want to keep only the device ID and Count. I don't need the location and date)
- Return: Save the final result in a data table and define its mapping.
Menu actions
In the menu of each pipeline, you will find the following actions:
- Edit: Apply changes to your pipeline
- Run Once: Save the results of your pipeline in the selected data structure under the Return Stage.
- History: View the actions performed on this job with the details of the user and the date.
-
Archive: Move this job to the archive when it's no longer needed.
Table actions
On top of the Data Toolbox Pipelines, you will find the following actions:
- + sign: To add a new job
- Select Page length: Define how many jobs you want to see on one page. The default is 25.
- Refresh: to refresh the list (the list will auto-refresh unless you have this section opened in 2 tabs/windows/users and you are applying changes on the other one)
-
Show archived: When enabled, the archived jobs will be displayed on the same list.
View Jobs Status
Under this subsection, you can follow the status of the pipelines you have run and monitor their progress.
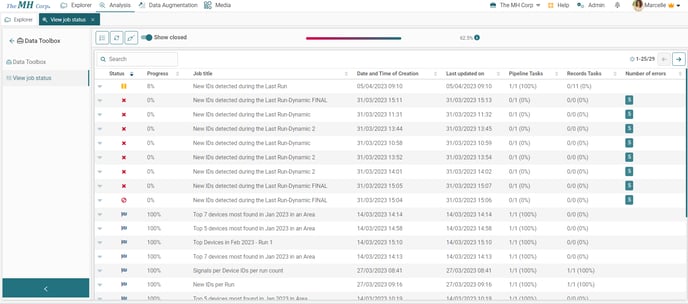
The status can be any of the following:
- Queued: the job is waiting in a queue to be executed.
- In progress: the job is currently executing. You can check the Progress Percentage in the next column.
- Done: all tasks have been completed. At this stage, the end result visible to the user might not be ready yet.
- Closed: the job is finished including the end result visible to the user.
- Canceled: the job has been canceled by the user.
- Interrupted: this happens only when the server restarts. It will be prioritized on the next run. No action is needed from the user.
- Error: an error has occurred preventing this job from being executed. The number of errors will be also displayed in the last column.
- Paused: The user has paused the job. However the planned task will continue until done, but the next task will be paused.
✅ The Job Title column shows the name of the pipeline in action.
✅ The Date and Time of Creation column shows the date and time of the pipeline in action when it was set to Run.
✅ The Last updated on column refers to the date and time of the last changes done such as the moment the job got canceled or it gave an error and stopped.
✅ The Pipeline Tasks column refers to the number of tasks that are planned and the ones that are completed.
✅ The Records Tasks column refers to the number of tasks that are planned and the ones that are completed.
✅ The # Errors column refers to the number of errors that occurred during the course of an iQ Web job that was not properly completed.