Network enhances stakeholder management and data analysis by analyzing dataset relationships
Table of contents
An Introduction to Network
Our AKTEK iO module for political economy analysis, stakeholder mapping, and network visualization allows better management of your stakeholders, critical issues, and relational data.
With NETWORK, it is possible to record, map, and analyze relationships and links between different datasets in new ways.
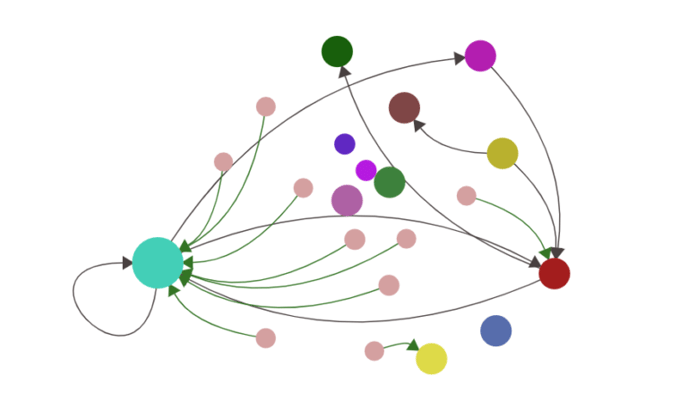
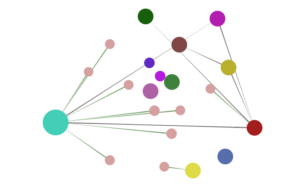
Network allows users to pull data from their created reports and visualize it in a way that shows the direct and indirect links between different values inside your database. These values are displayed as nodes (circles) and links (arrows) that illustrate the relationships between them. The display of network nodes can highlight non-trivial data discrepancies that may otherwise be overlooked.
Fundamental Concepts
Nodes
Nodes are shown as circles or images that represent different elements or unique values from your database. The color of a node represents some known classification. For instance, a network of voting records could use blue for Democrats and red for Republicans.
Size can also be used to represent the number of connections between nodes or any quantitative value in your report (such as influence scores, or funding).
Edges or links
Links (sometimes referred to as “edges”) represent relationships between different nodes. Optionally, each edge can have a weight, which is a distinct value describing the strength of a relationship between two nodes.
Furthermore, each edge can be directed or bi-directed, meaning that the relationship is either one-way or two-way. Several graph settings can be tweaked when constructing node-link diagrams based on the above.
Edge color usually represents the type of relationship. Edge size is also commonly used to represent edge weight or strength as mentioned above.
Network Layouts
Once the visual elements for the nodes and links are determined, the network must be arranged in some way to deliver analytical value. As such, methods for organizing it in a given space are called Network layouts.
Network layout algorithms usually try to optimize node placement based on criteria like minimizing edge crossings or the distance between similar nodes. There are several ways to define node similarity, but in layout algorithms, it is usually based on the number of edges shared between nodes.
In AKTEK iO, administrators will be able to experiment and tweak different layout options to achieve their desired graph.
In conclusion, Network visualization can be used for anything relational. From roads and supply chains to electoral analysis and the internet, any two or more items that share a relationship can form a network and help you uncover critical insights.