
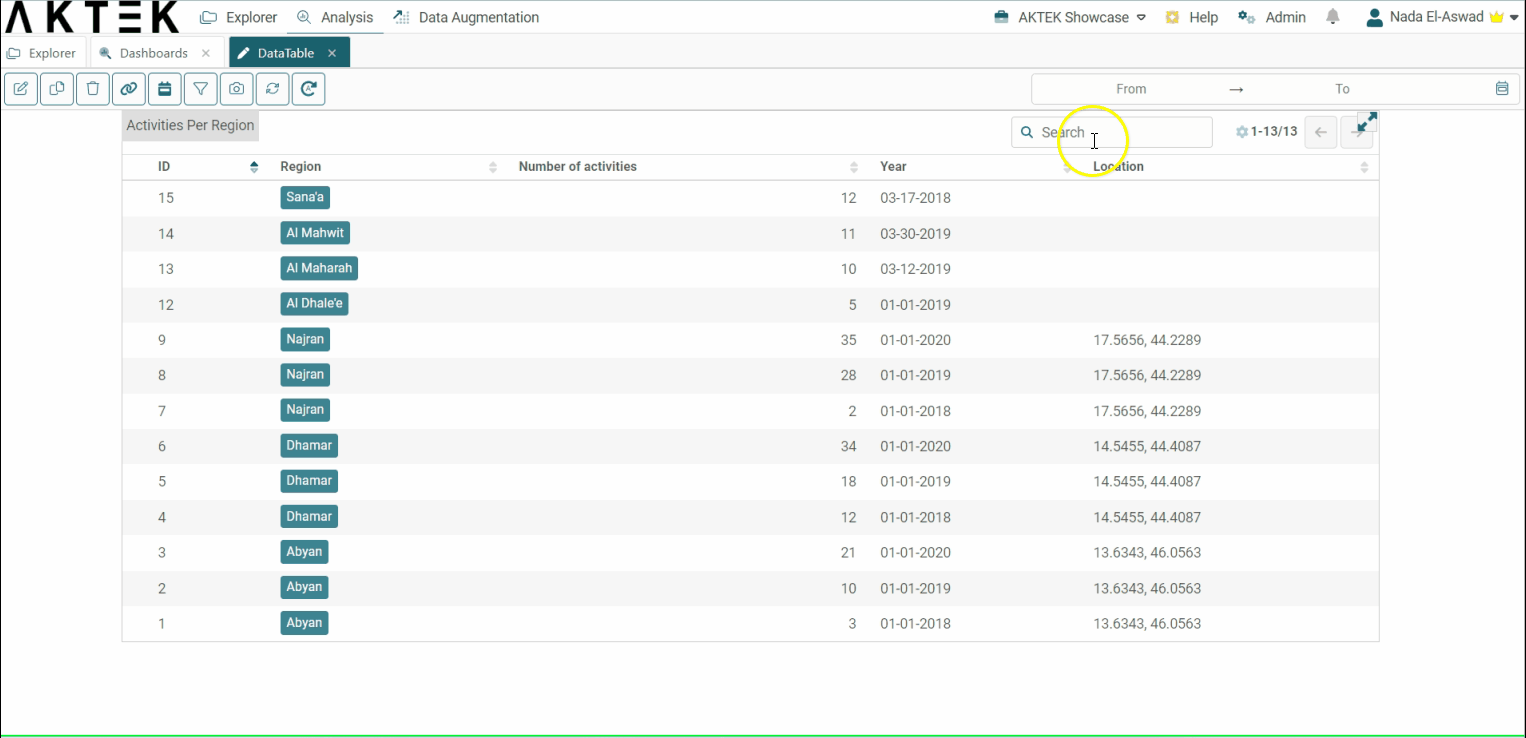
The Data Table component showcases crucial data from a specific report on a dashboard
Table of contents
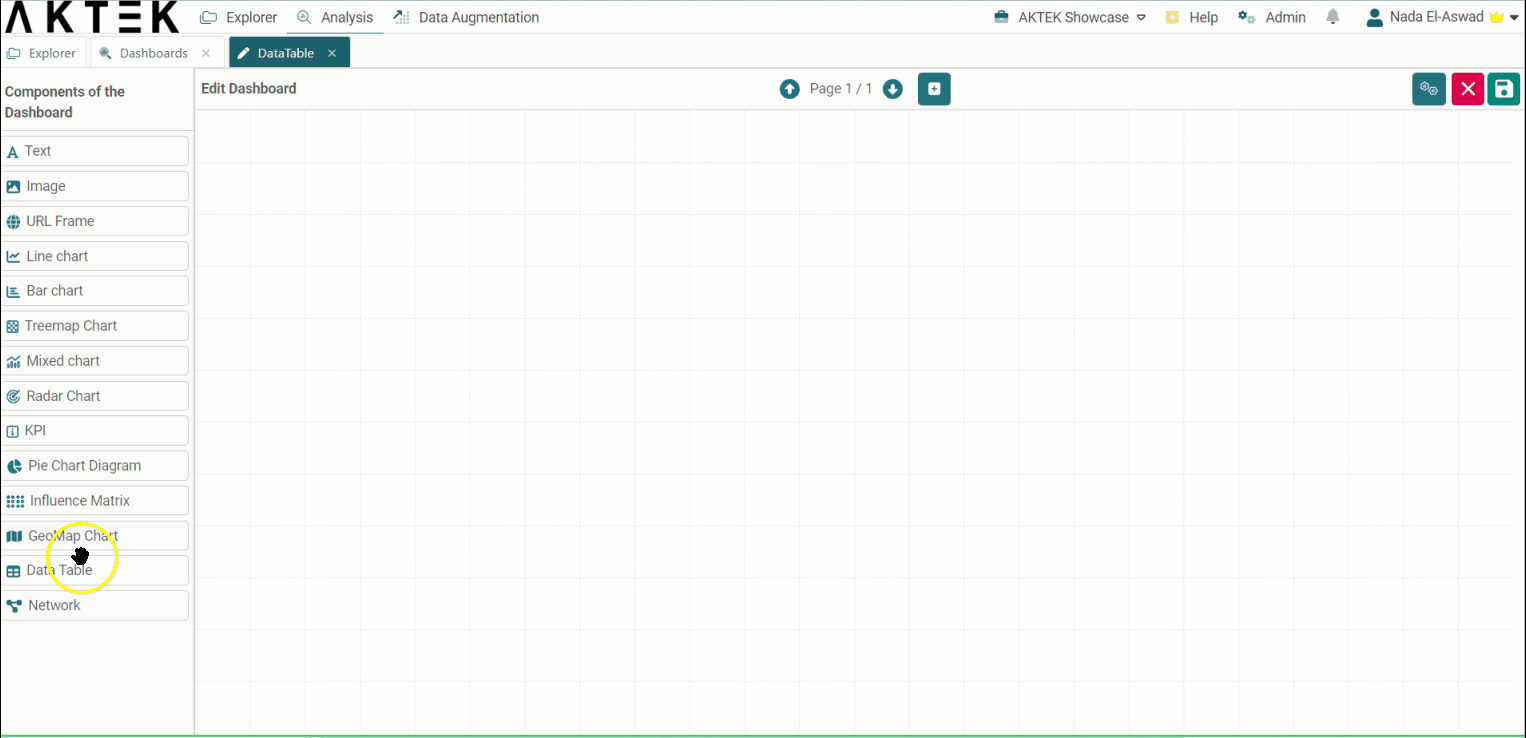
Add a Report/Data Table to your Dashboard
Go to Analysis tab > Dashboards > Create/Edit a Dashboard
- Drag and drop the Data Table component from the left-side menu into the canvas, and click on Edit;
- Give it a title (optional), and choose the table (data structure) that you want to display;
- By default, all the columns visible on the table view will be visible here. You can still add or remove columns under Hide these columns;
- Apply and Save.
- After you save your dashboard, the table will appear, and you can do the following actions.
- Search for a specific record by using the search bar shown at the top;
- Resize the columns or change the navigation mode, under the settings icon;
- If your data contains a reference, you can double-click on it to open the full record;
- If your data contains a URL, you can click on it to open it in a new tab;
- Scroll vertically and horizontally in order to see all your data;
Design
- Title font size and Title color: Edit the default size (12) and the default color (black)
- Title alignment: You can choose one of the six positions (top left, top center, top right, bottom left, bottom center, bottom right). Click on the bubble of the desired position.
💡 You can learn more about Actions on Dashboard's Elements.