Filter data with our Smart Filters to gain control and flexibility in visualizing your data on Networks
Table of contents
Filter in View Mode
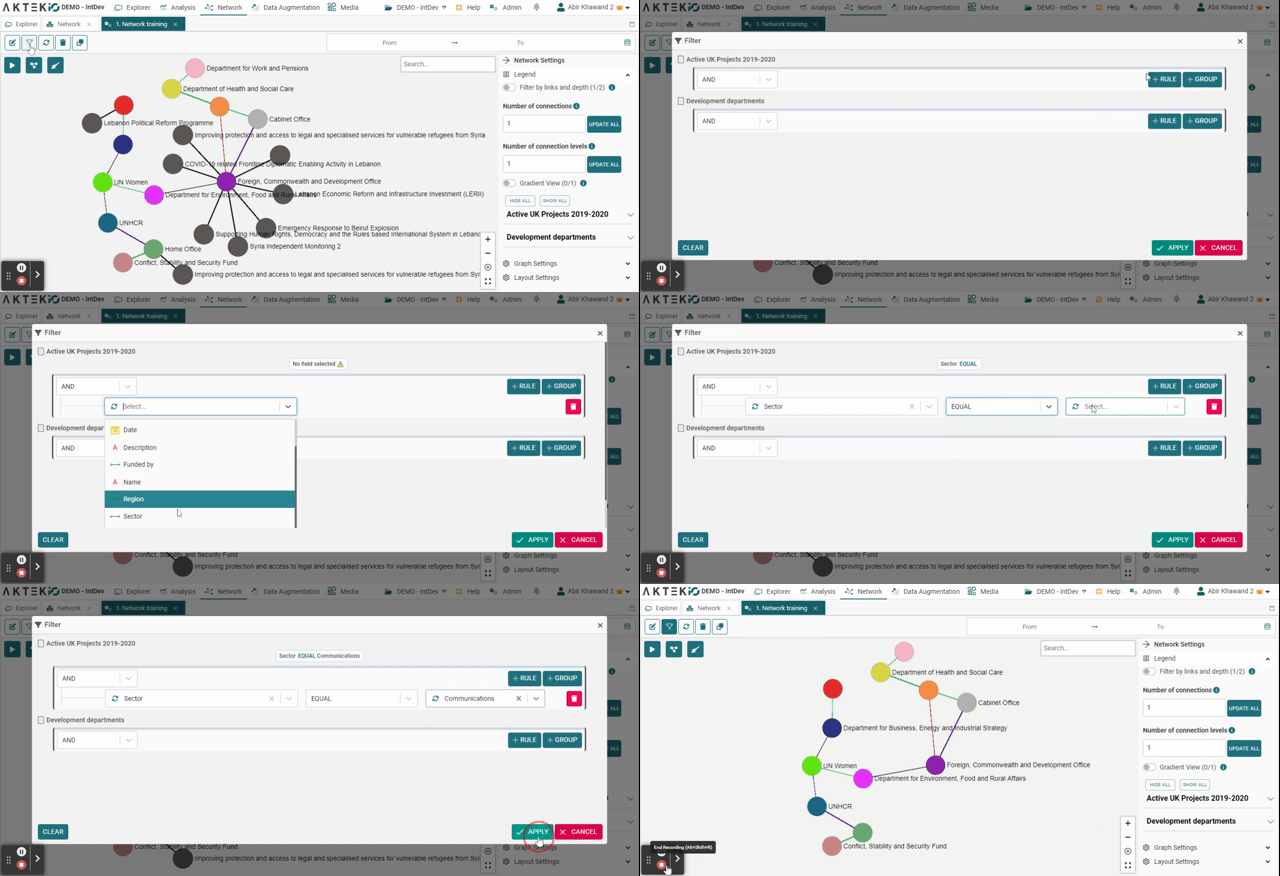
- Click on the Filter Data button in the top left corner. A pop-up window will open with the reports available to filter data from.
In this example, we will select the report “Active UK Projects 2019-2020”. - Once you select a report, a query window will open where you will be able to add rules or groups of rules that will determine the information to visualize inside your report, delimiting your view to the desired filter.

- In this case, we will create a rule that filters for projects that belong to the communications sector. For this, we click on + Rule and then mark the variable “sector” equal to “communications”.
- Once ready, click on Apply to see your network graph filtered;
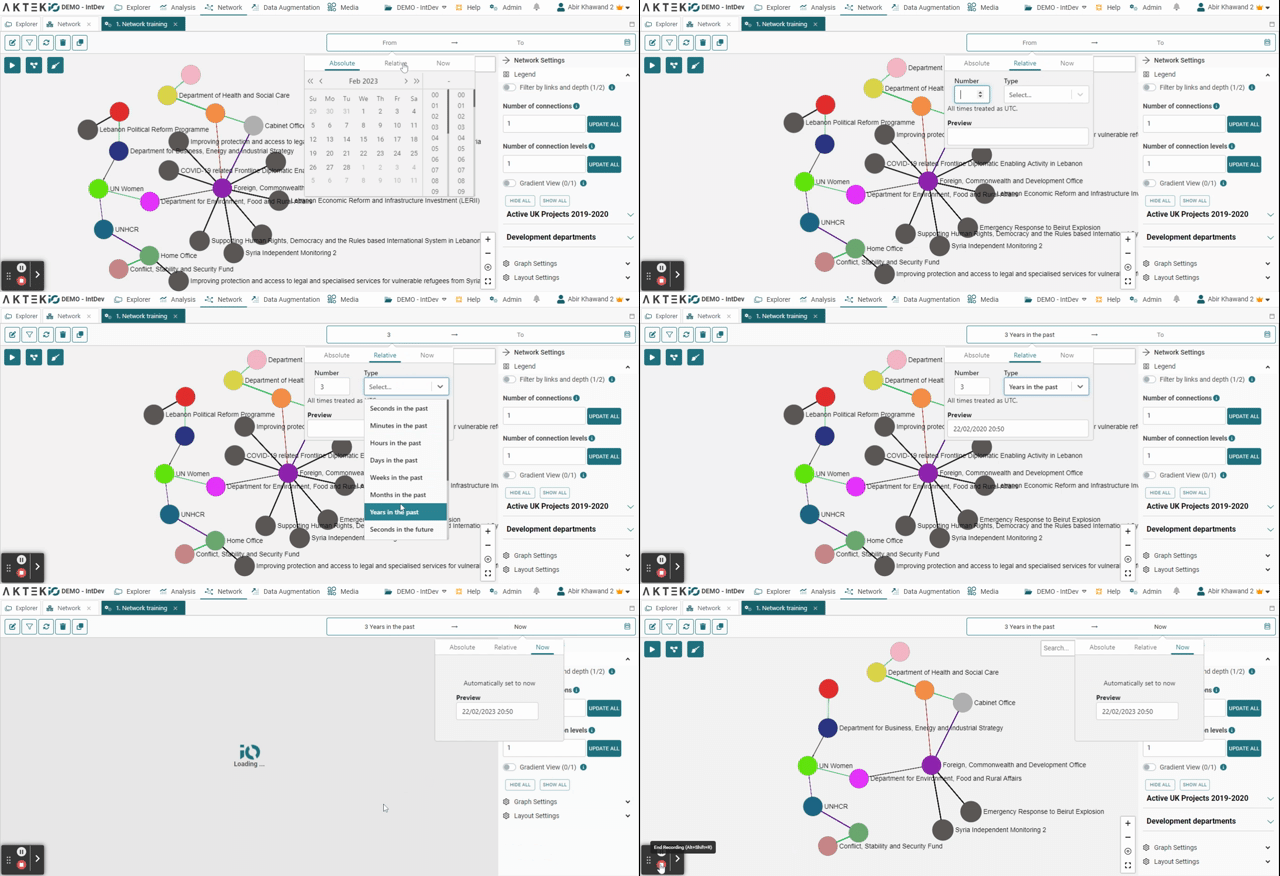
- For quick access to the Date and Time filter, use the Date/Time filter available on the top right. You can filter by absolute or relative dates.

✅ Repeat this process every time you wish to filter data in your Networks.
💡 Keep in mind that you can always go back and change, edit, or delete the rules established. They can be as simple or as complex as necessary to achieve the desired outcome.
Default Filter - Edit Mode
Set a filter directly on the report
-
Click to Edit a Network to drag and drop a new report or Edit an existing report;
-
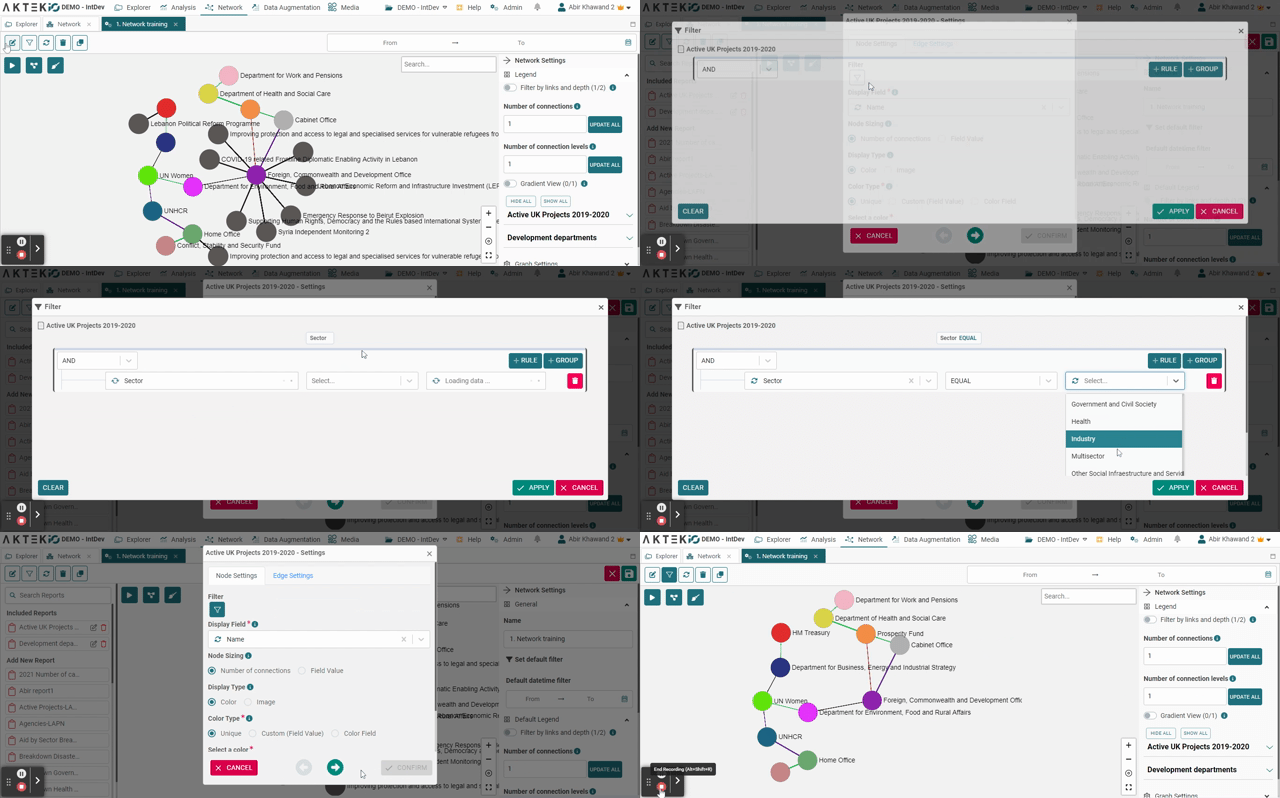
Click on the Filter Icon at the top;
-
Set your rules(s) and Apply;
-
Click on the arrow to go to edge settings and Confirm;
-
Save.

Set a filter under General Settings
-
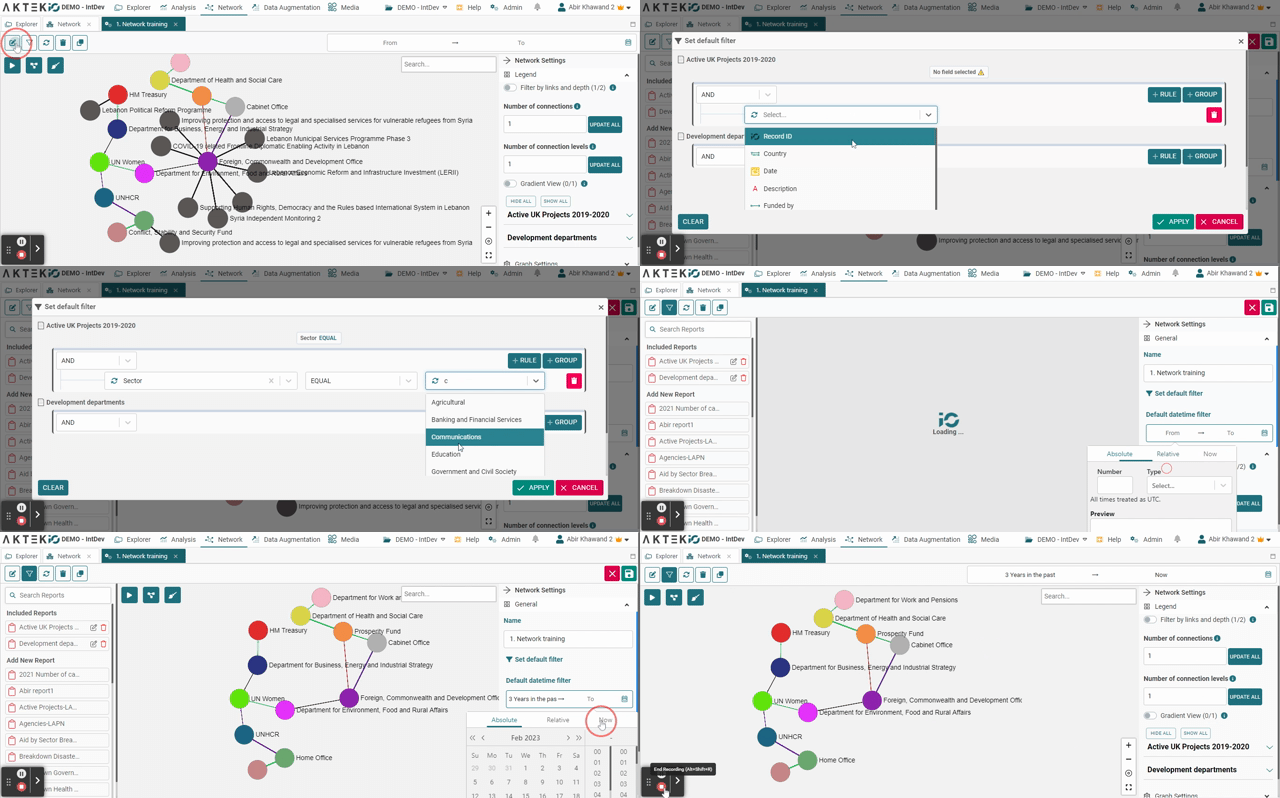
Click to Edit a Network;
-
To the right, find Network Settings, and click on General;
-
Select Set as Detaulf Filter and choose your filter options and/or the Date/Time filter;
-
Save.

💡 These filters will be saved and applied every time you open your report. It could be useful for high-volume networks in order to reduce the number of nodes and enhance the loading time in order to show only relevant data.
