Key Performance Index is a component that displays and monitors important metrics on your dashboard
Table of contents
Add a KPI Component
Go to Analysis tab > Dashboards > Create/Edit a Dashboard
-
Drag and drop the KPI component from the left-side menu to your dashboard;
-
Edit the component to configure the properties;
-
Add a Title (mandatory) and a Subtitle (optional) to describe the displayed value;
-
On the Data section, add a Measure by selecting an aggregation and a data structure/data field;
.gif?width=640&height=292&name=AKTEK%20iO%20(24).gif)
-
You can apply a filter to the data calculated by clicking on the filter icon next to the data structure name and add the desired rules;
-
By default, the displayed value is the result of the aggregation, however, you can change it, by configuring the Conditional Display:
- Click on + Condition, and set the rules;
- Fill in the Display Value. For example, if the result of the aggregation is less than 10, you can make the display value "Too low";
- You can also change the text color and the background color based on the result.
.gif?width=640&height=292&name=AKTEK%20iO%20(22).gif)
Appearance
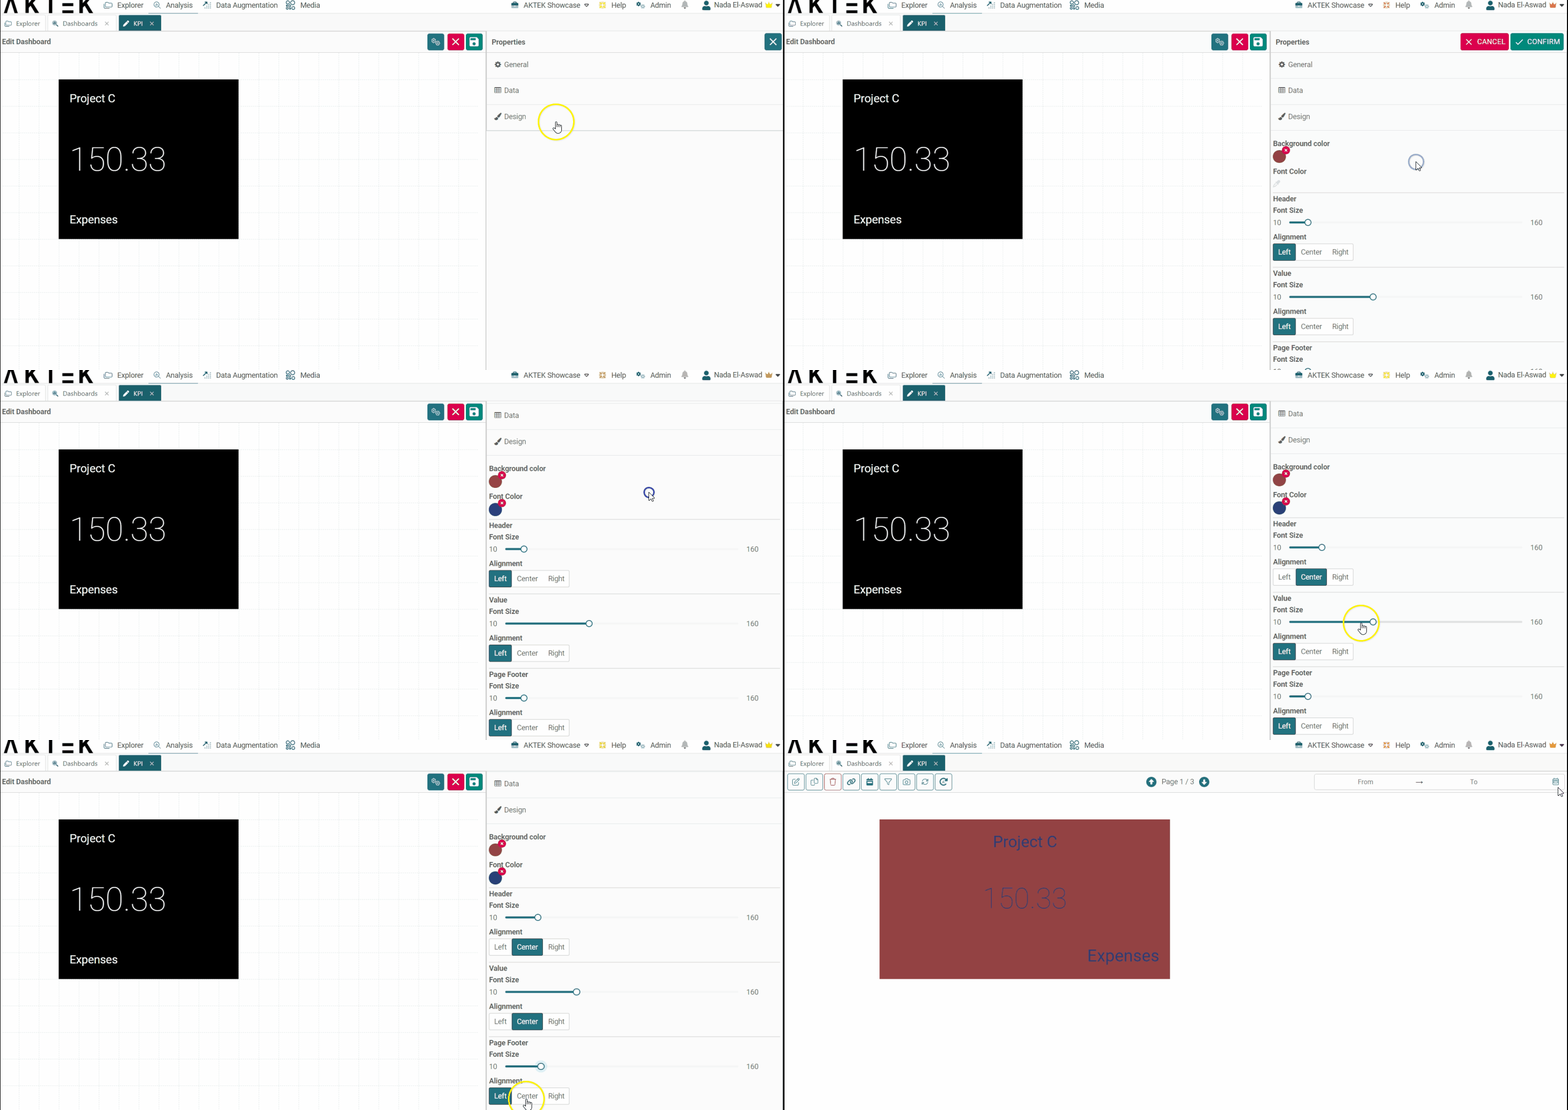
- Edit the component and click on Design;
- Customize the text color, the background color, and the font size plus alignment of each element. If you have a default background color saved under the company settings, it will show automatically;
- After saving your dashboard, you can also click on the expand icon, in the top right corner of this component, in order to display it in full screen.

💡 Click on the link to know more about Actions on Dashboards Elements.
