Define the design of your network to optimize the interpretation of it and enhance performance
Table of contents
General
Go to Analysis > Networks > Create/Edit a Network
General is the first title that will appear in your legend once you click Edit on your selected Network (left-side section).
Under these settings, you can change the name of your network and set the default data filter or date and time filter. For more info, check here.
Default Legend
Default legend configuration means that, once you are creating or editing a network, different toggle options can be saved (from Edit mode) for any user in your company to immediately see them pre-defined.
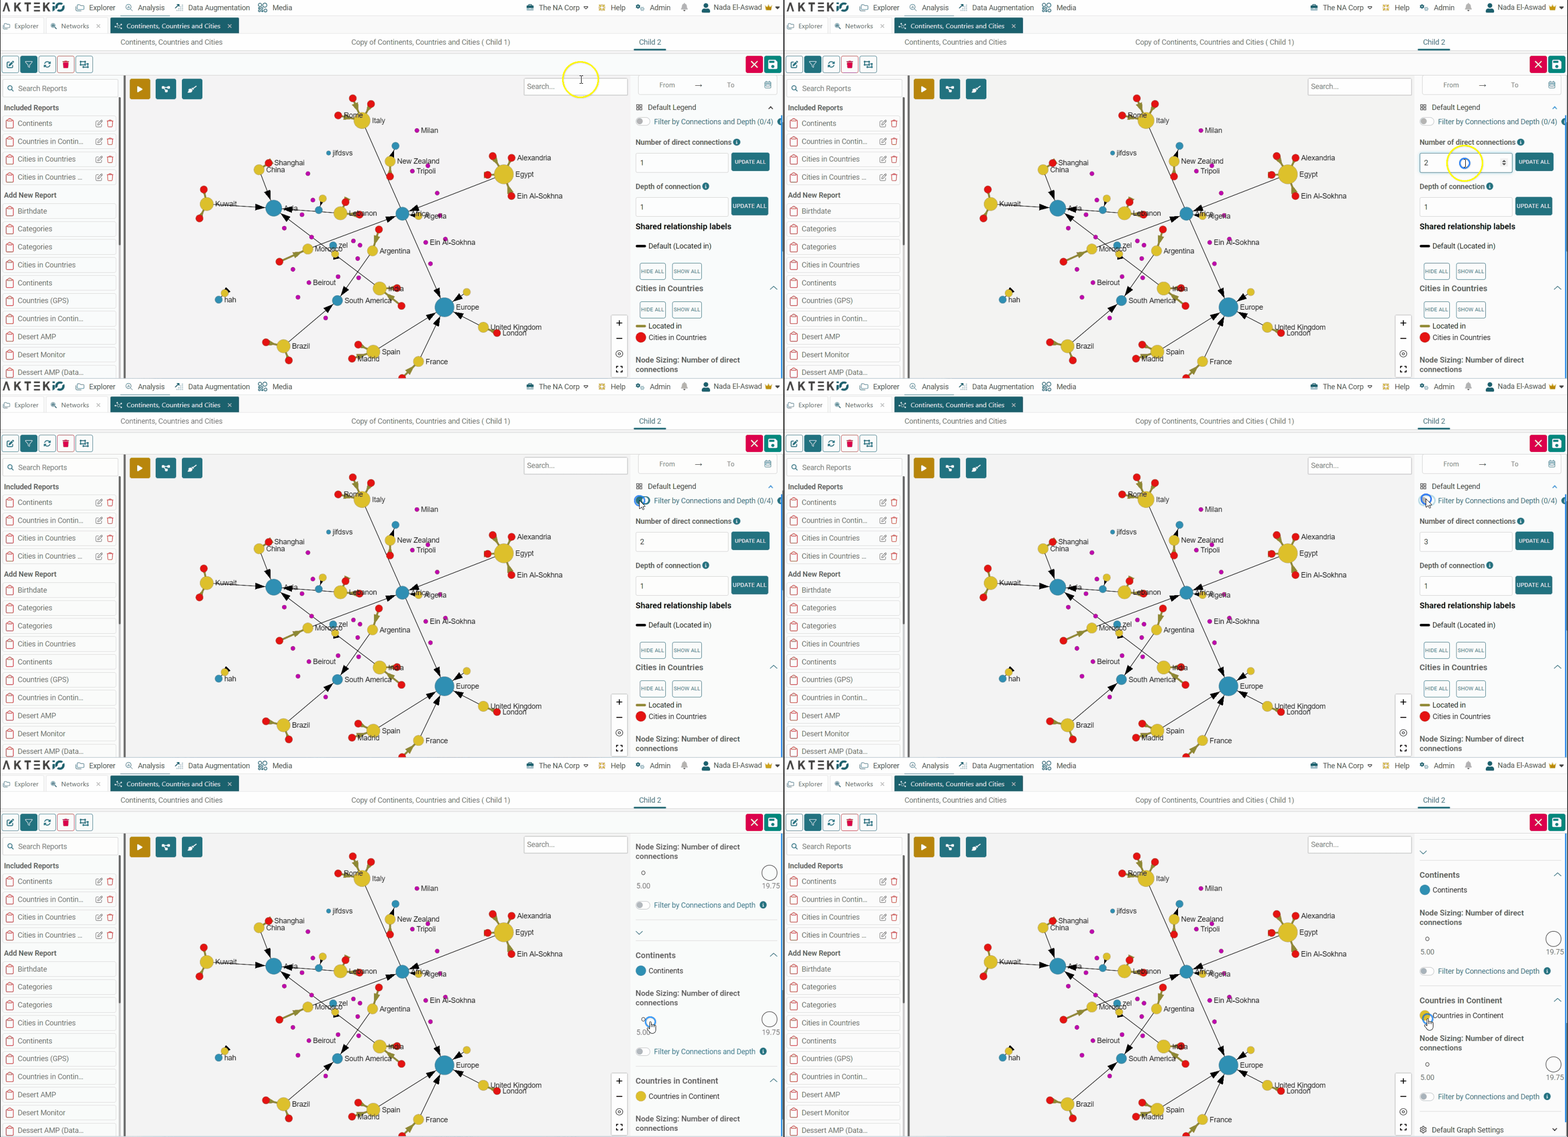
- Filter by Connections and Depth > Number of direct connections and Depth of connection: The number of direct connections will allow you to show only the nodes having at least the defined number of connections. While the depth of connection will let you show only the nodes going outwards to x depth in the network. These will apply only when the main toggle is enabled. They will apply to all reports included;
- Hide all/Show all: it will hide everything in your network in order to allow you to select specific nodes from the reports (check below). You can click again on Show all to re-display all nodes.
-
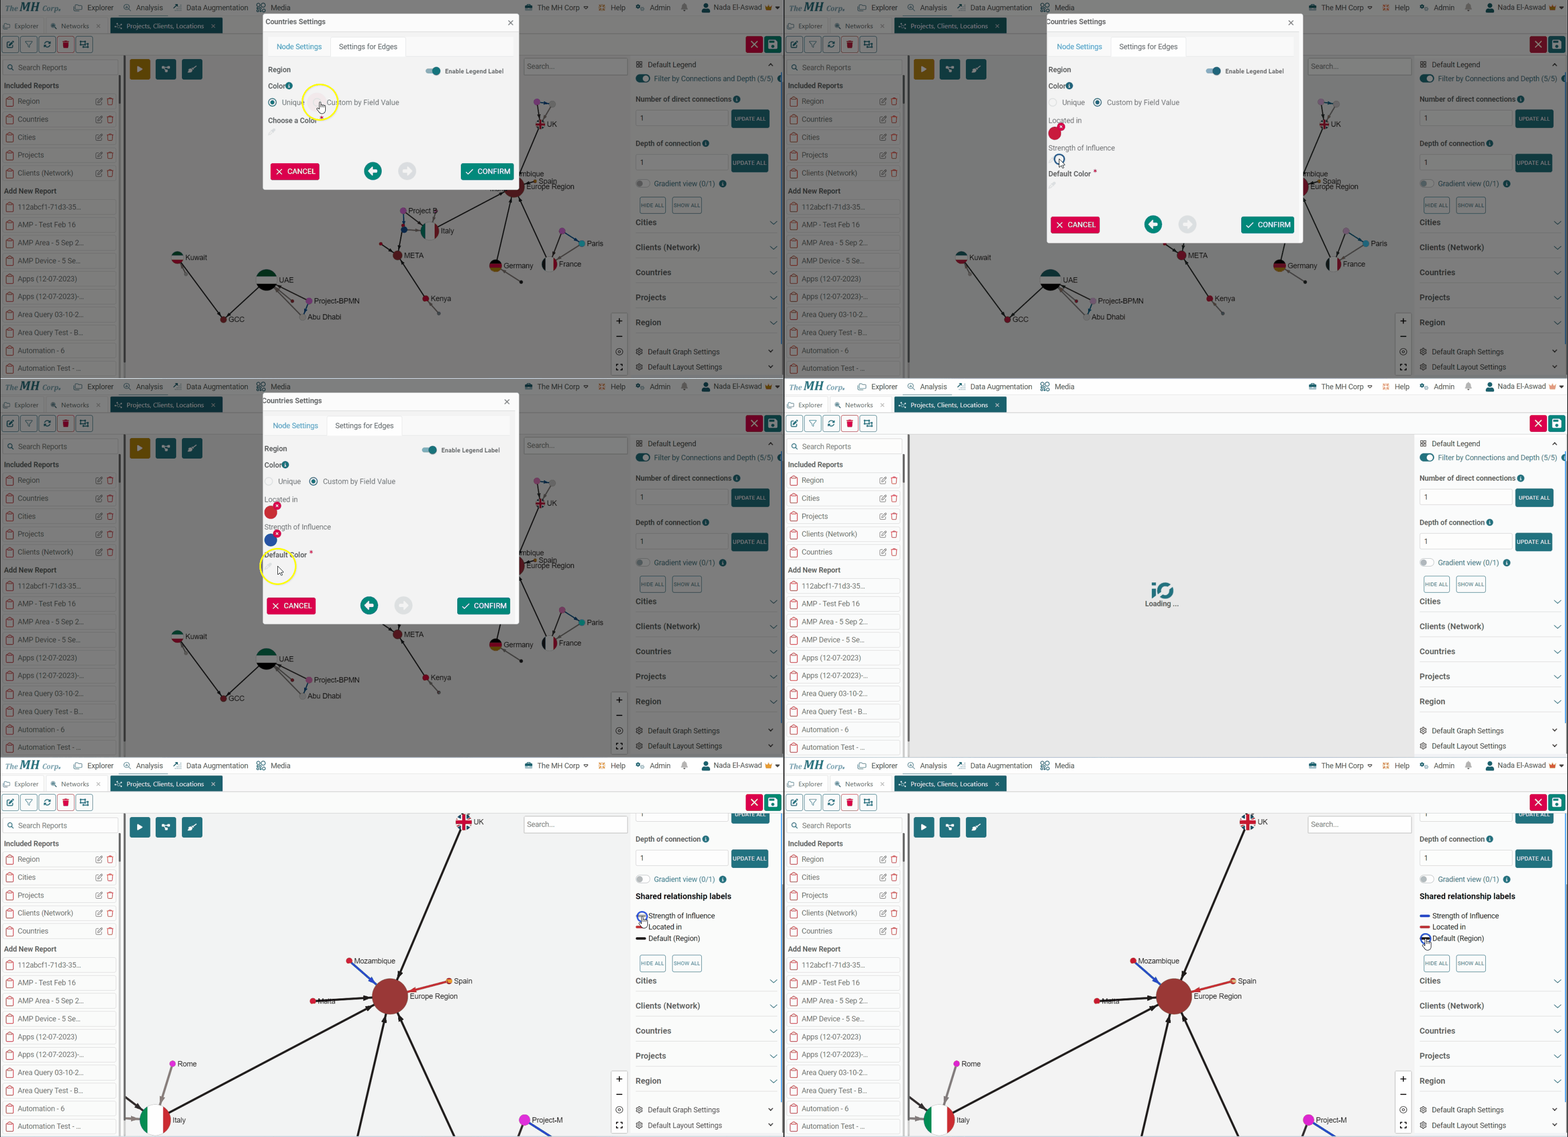
Shared relationship labels: it will show you the color used for each relationship category. From here, you can also disable any of these relationships;
-
Report Title(s): you will be able to collapse or open them to see your node categories or links/edges activated for each report.
-
To add, remove or edit any of the reports from the legend, go back to the included reports and click either the pencil or trash icon;
-
Once you are happy with the reports on your legend, check if the node color categories are showing as you expect, you can click them to make nodes appear or disappear.
-
Graph Settings
Graph Settings in Network will allow you to tweak different options that will make your graph easier to read and understand.
Changing the options below in Edit mode means that this is how your network will look once a user opens it or reloads.
-
Min and Max Node size determines how big a difference there will be between the smallest and largest node on the network;
-
Min Arrow size will affect the size of your arrow’s width;
-
Label threshold determines at what zoom level text labels will appear;
-
Unselected Opacity defines the level of transparency all unselected nodes will have. To test it, click on one of the nodes;
-
Min and Max Edge Size determine the size of the link relative to the weight of the link;
-
Tweak your options in order to find the best way to draw and showcase your network;
-
Select the type of edge/link line you want to use and if it adds any analytical value to hide or show single nodes.
Layout Settings
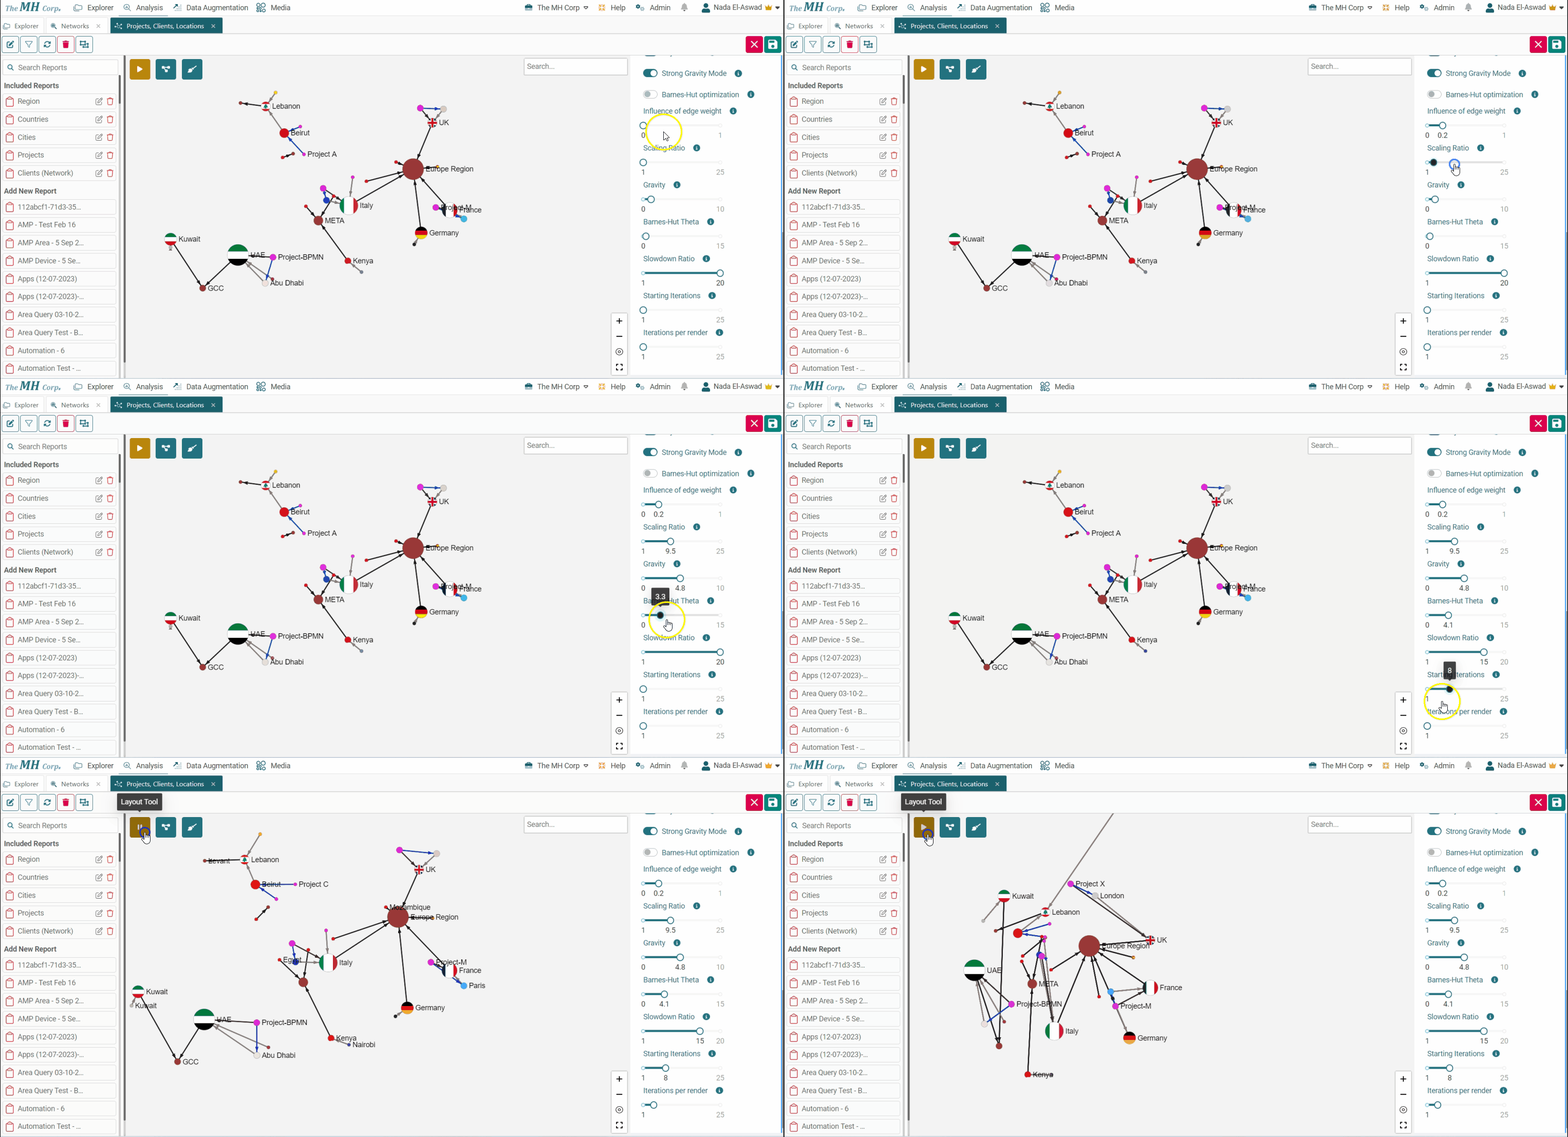
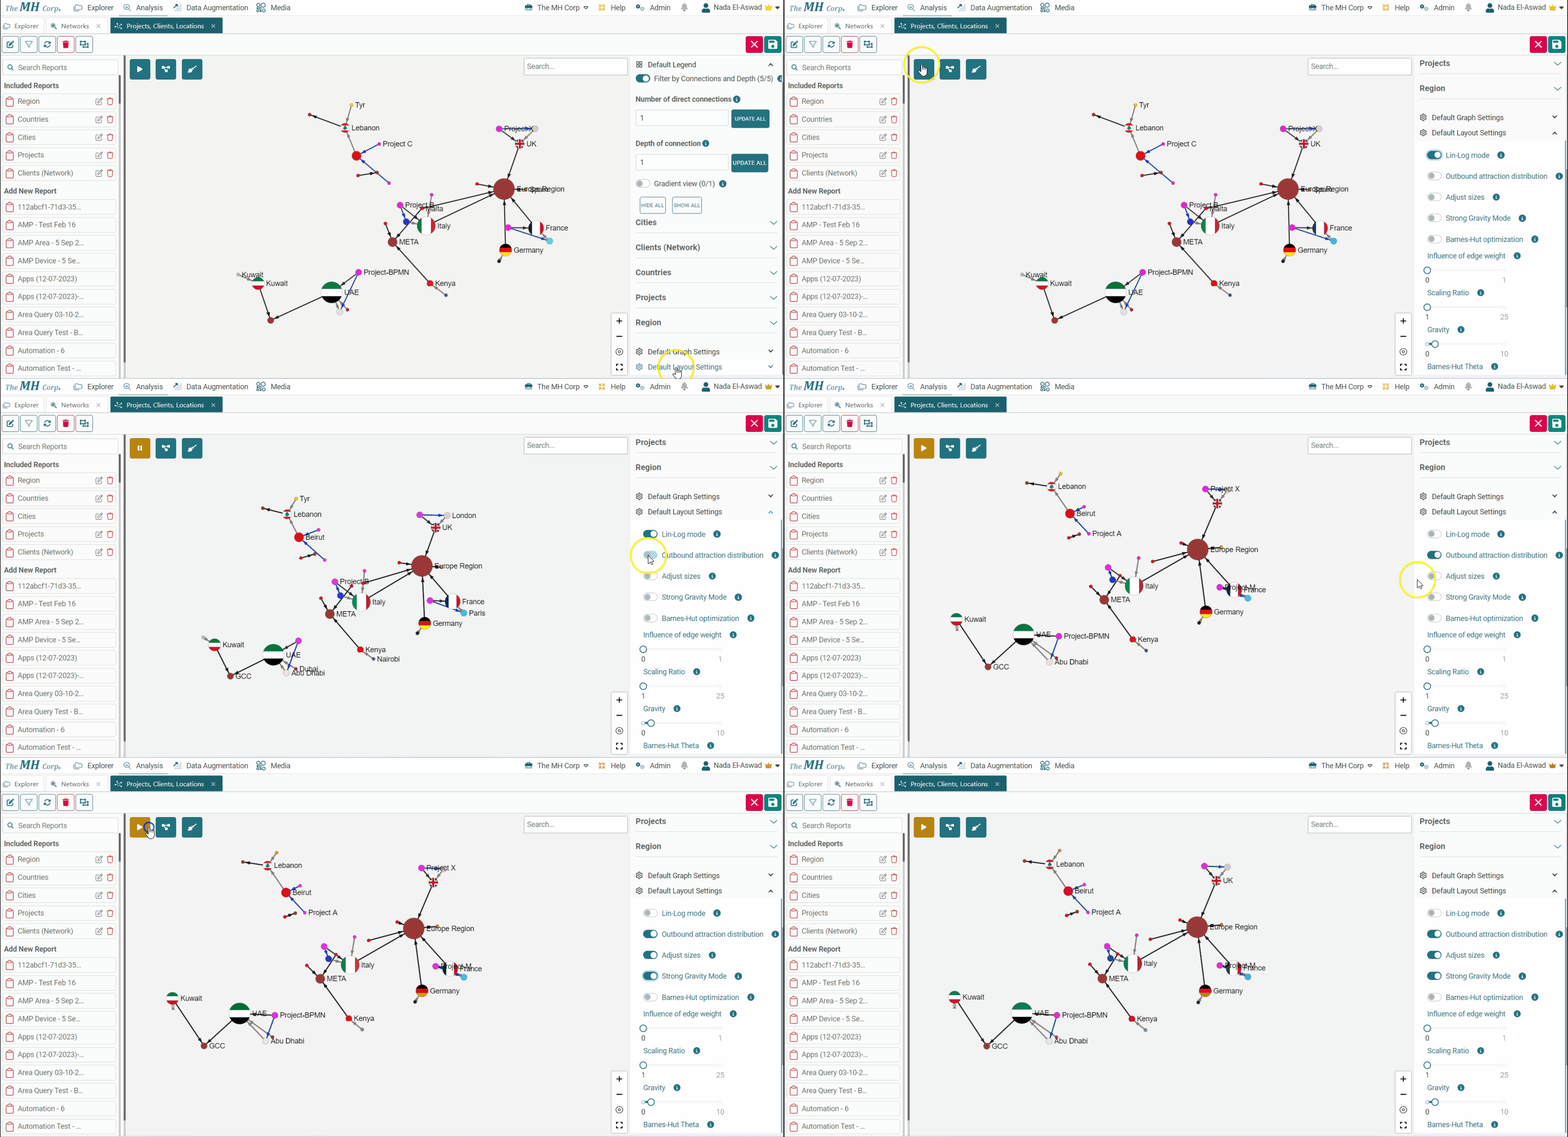
Layout settings will allow you to use the Play button on the top left to get different nodes and link arrangements. Your result may vary from one network to the other depending on the number of nodes in your graph, the relationships they have, or the values that define their size.
These settings are not one-size-fits-all rules, meaning that one arrangement may work on one network but not on the other. Make sure you click the Play button on the layout tool and start tweaking your options in order to get the visualization that gives the most analytical value.
Here are some guides to allow you to understand the potential impact of each option:
Algorithm Configuration
-
Lin Log Mode: makes clusters tighter;
-
Outbound Attraction Distribution: nodes are attracted to other Nodes they have links with;
-
Adjust Sizes: better open distribution of nodes in the space;
-
Strong Gravity Mode: circular organization towards the center;
-
Barnes Hut Optimize: this is useful for large graphs but harmful to small ones;
Algorithm Variables
-
Edge Weight Influence: the influence of edge weight value when added to the data. "0" is no influence, and "1" is normal;
-
Scaling ratio: how dense or sparse you want your graph. "0" means very dense, and "25" means very sparse or scattered;
-
Gravity: the attraction force to the center. With higher gravity values, the nodes will be more attracted, preventing islands from drifting away;
-
Barnes Hut Theta: efficiently compute repulsive forces at each time step;
-
Slow Down: slow down the movement per iteration;
-
Starting Iterations: number of iterations to be run before the first render;
-
Iterations Per Render: number of iterations to be run before each render.
