When building reports for networks, follow these steps to effectively create meaningful visualizations
Table of contents
- Edit your report for Network
- Create relationships between nodes on the same report
- Create relationships between nodes on different reports
- Fields to create powerful Networks
Edit your report for Network
As you may have read in our Network Introductory article, networks are built from Nodes and Links. In order to use your database for this type of visualization, you must keep in mind the following tips and steps when building or editing your reports:
- From a data perspective, Nodes can be almost any field, whether text, dropdown, natural or decimal numbers, etc. Keep in mind that the labels that will appear next to your nodes will correspond to the unique values that have been entered for the field you selected.
For example: if you select the field Name each node will appear with the respective text entered as a name in that specific field. In this case, AKTEK iO won't do any duplication checks, which means that if you have two similar names, they will each appear as different nodes. The reason behind this is that each entry contains different information that may vary from one entry to the other.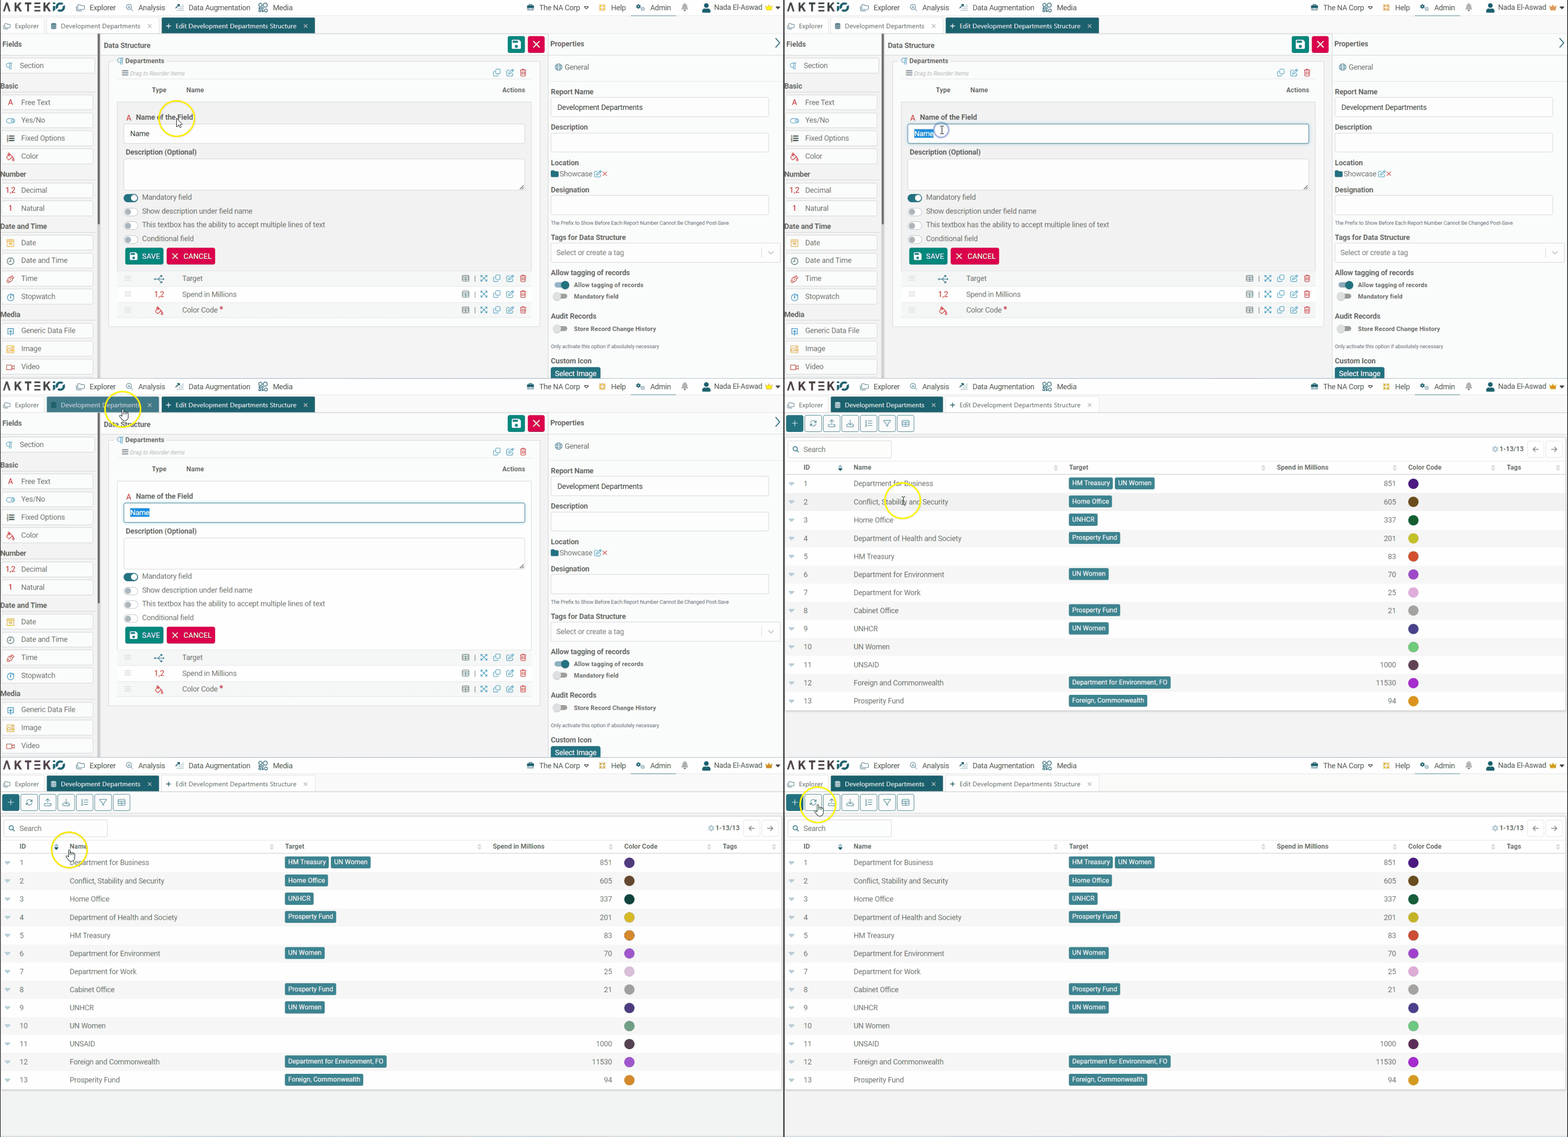
-
To create Links or Edges from your existing reports, it is important to understand that AKTEK iO will automatically create relationships between data or reports when you use any of the following fields:
- Reference
- Multiple Reference
- Connected Reference
These reference fields connect reports with each other. They allow you to avoid re-entering key data for each of your reports and use them as dropdown options.
-
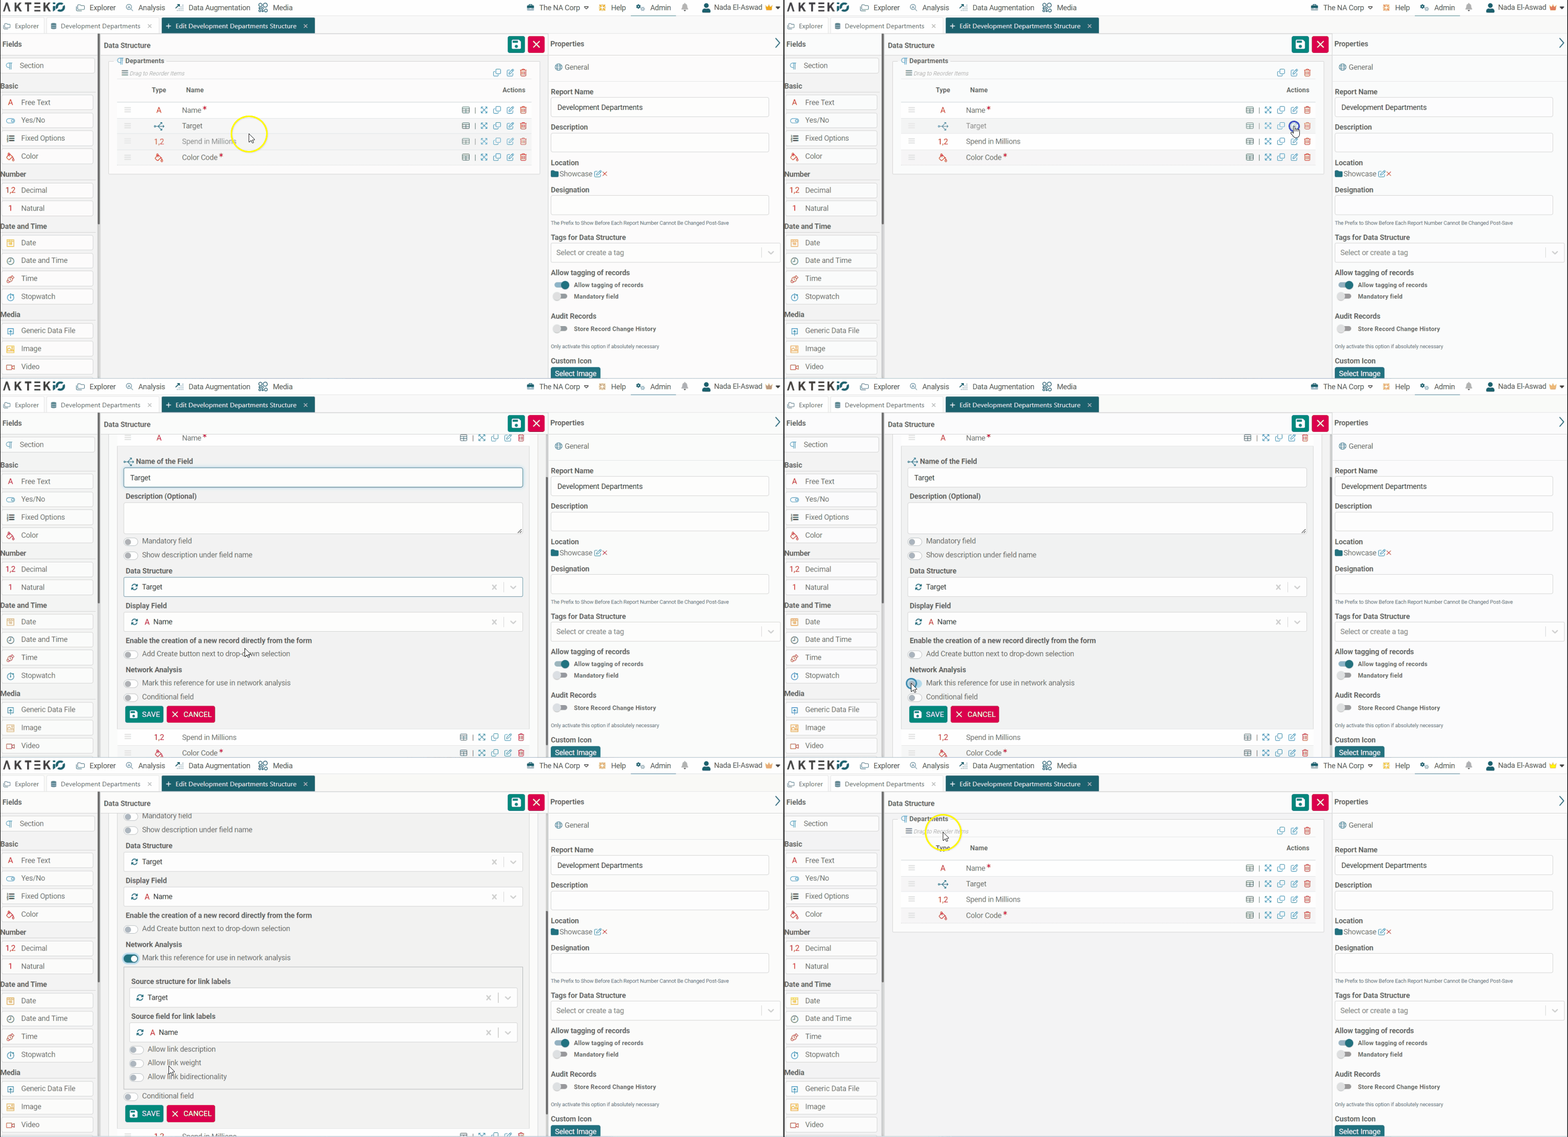
To create or edit a report in order to have Network Links or Edges, go to the Admin > Data section and edit or create your report.
-
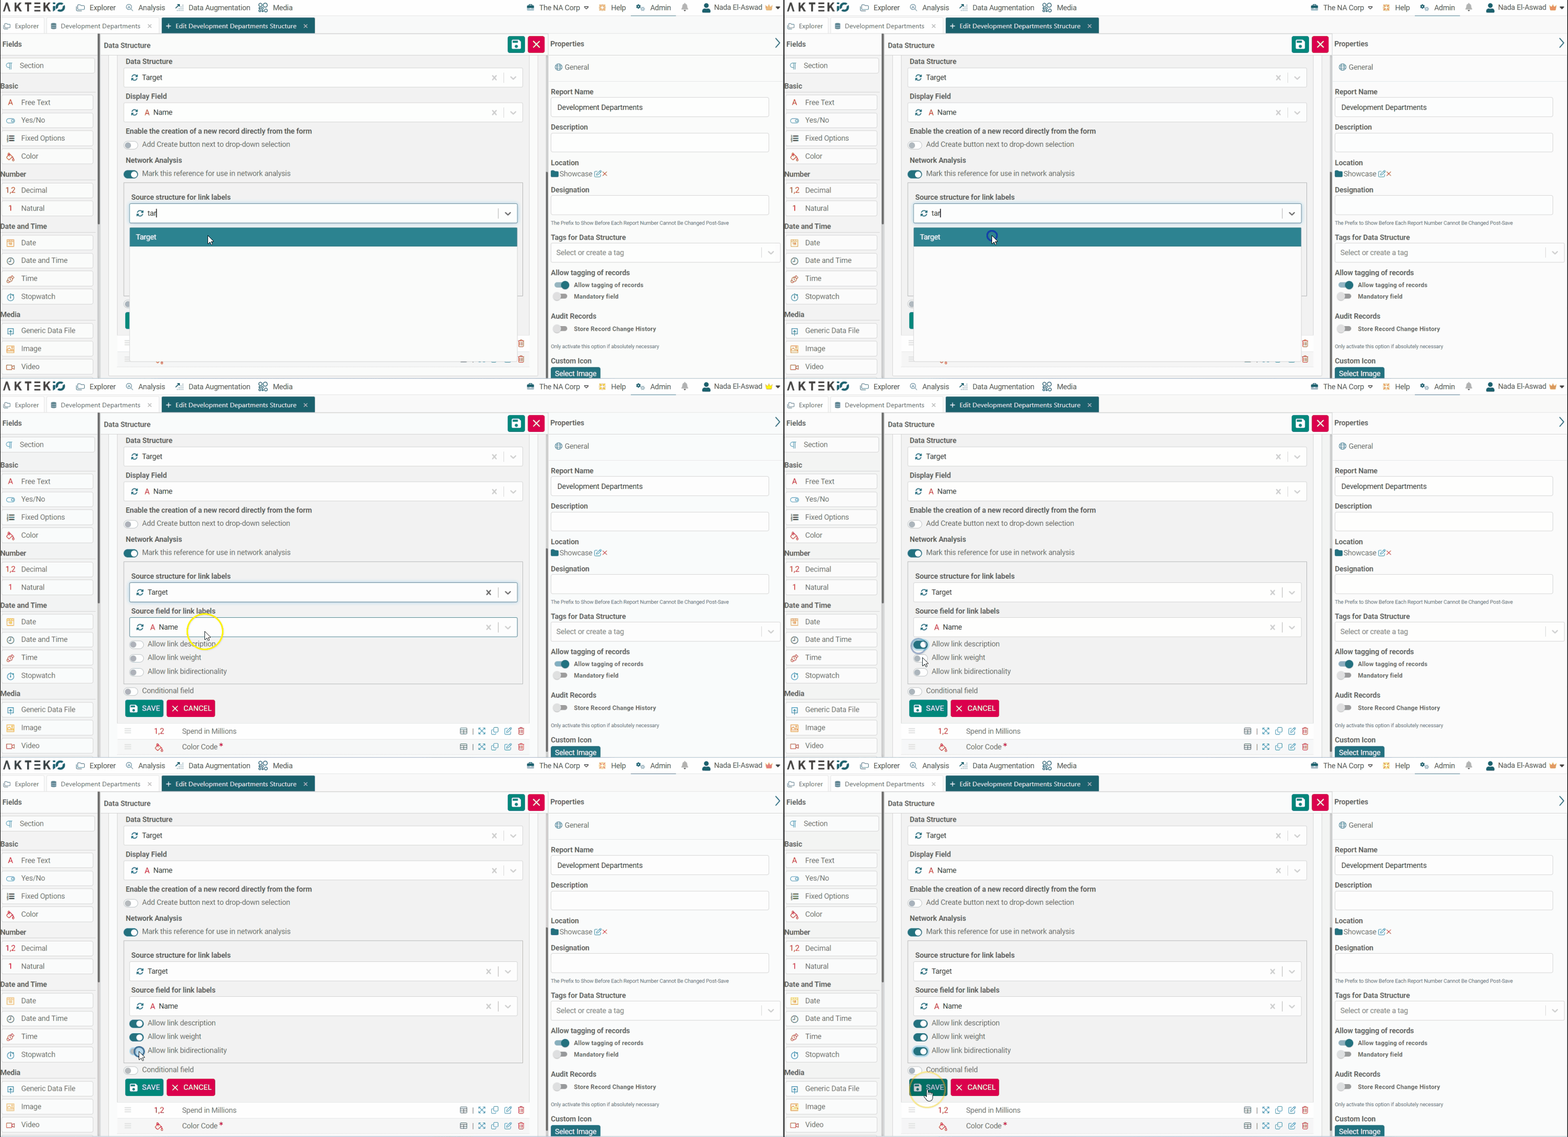
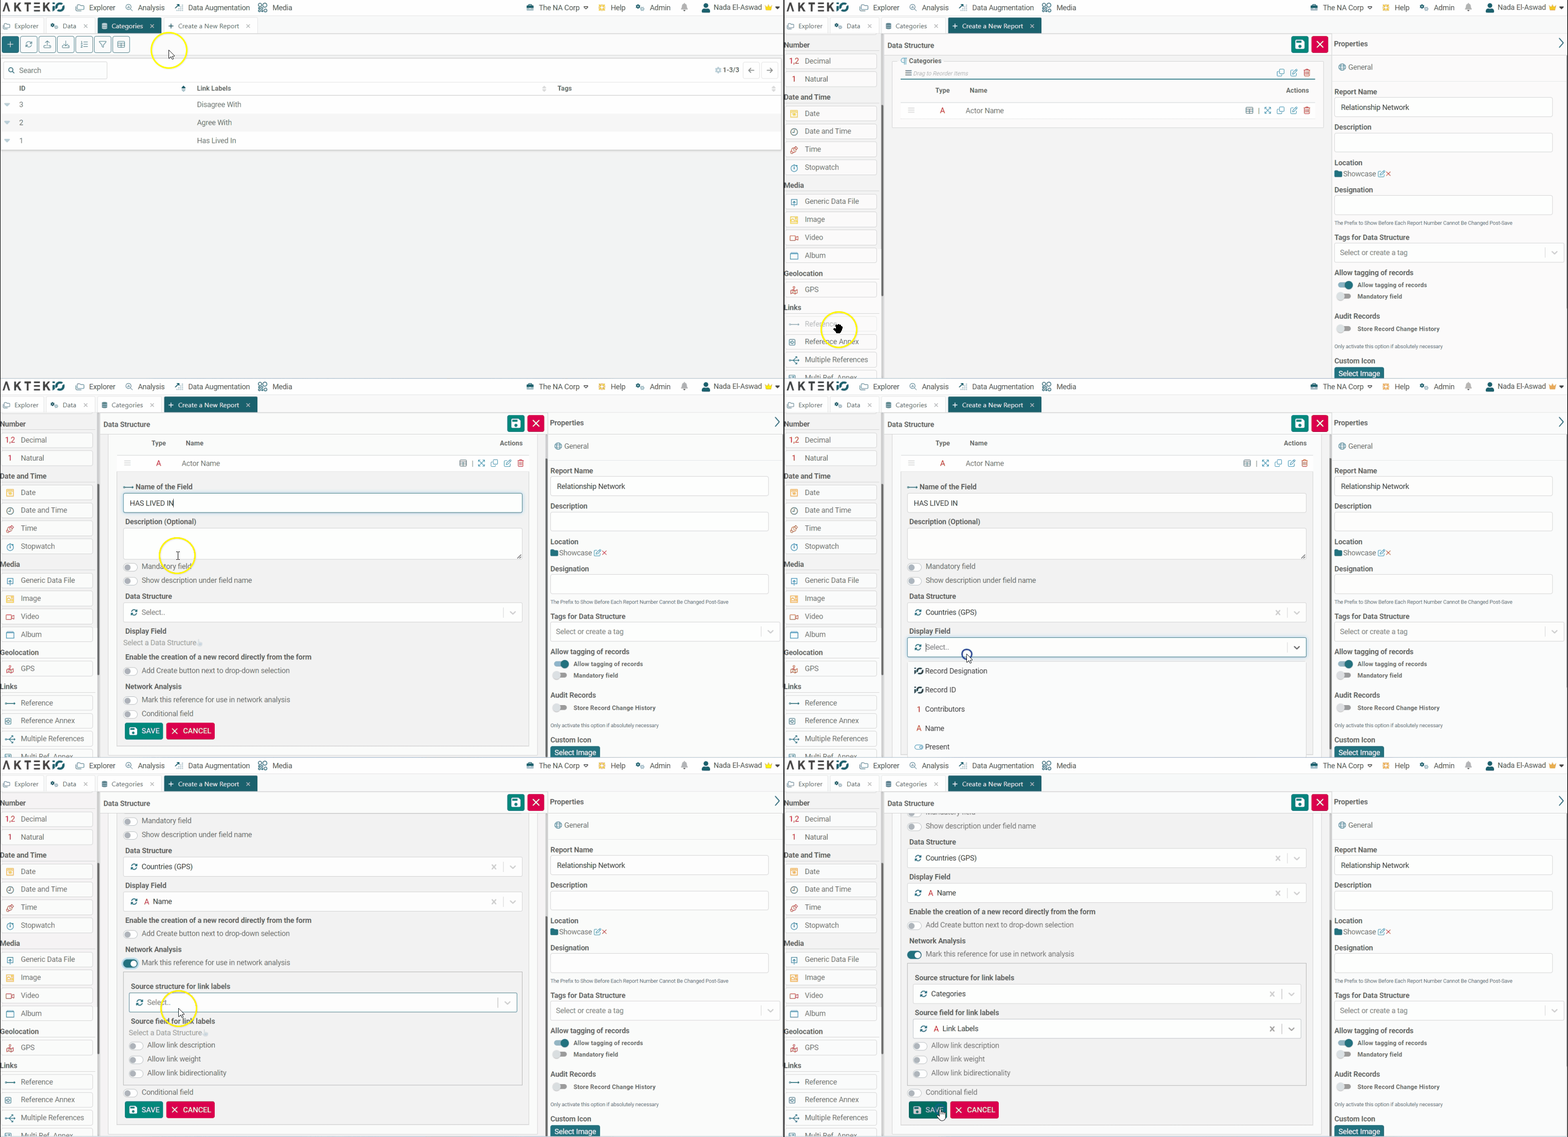
You can add a reference field to your report and toggle ON the Network Analysis option available. Once you do this, you will be able to select which Data Structure to use in order to label your connections. You will be asked to select an existing report and field. Each value inside the selected field will be an option for you to label your different links.
-
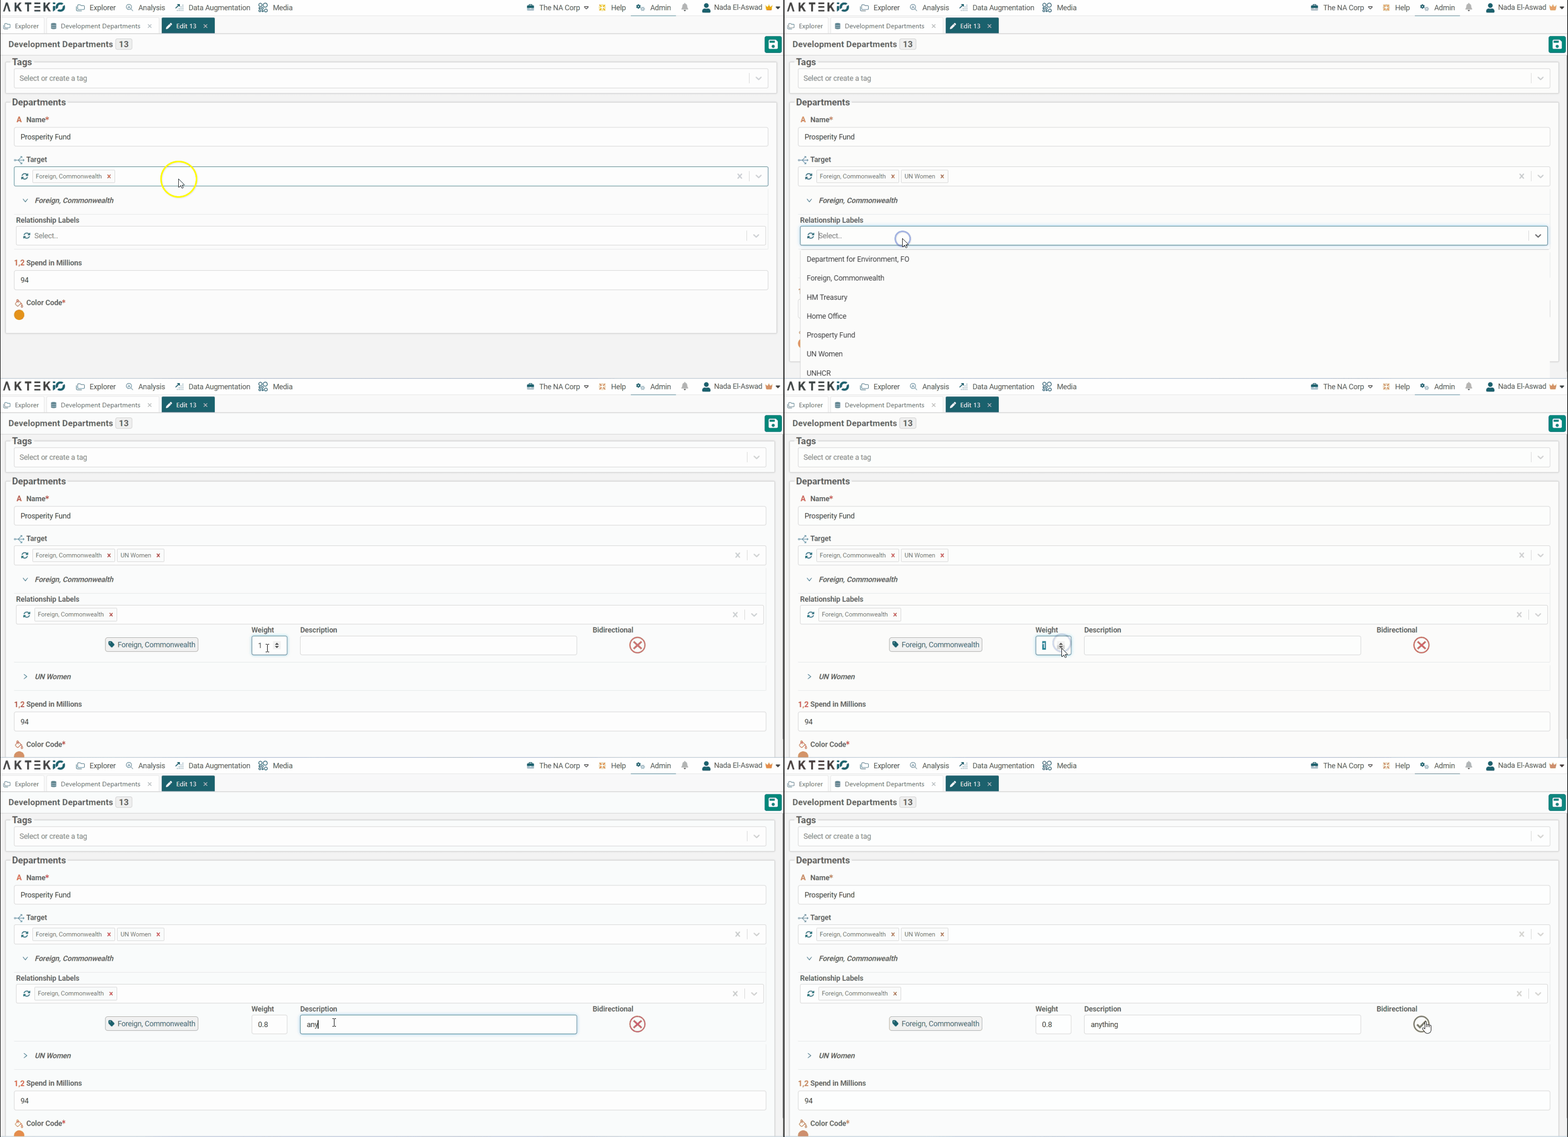
Toggle different options to add more information to each link:
-
Description: allows you to write a text description or note about each link you create;
-
Weight: numerical value from 0 to 1 allowing you to define the strength of the relationship which will later affect the arrow's size;
-
Bidirectionality: a boolean option that allows you to say if a relationship is bidirected or not, this will affect the number of arrowheads each link has.
-
Create relationships between nodes of the same report
If you want to create relationships between nodes of the same report, add a reference or multiple reference field by selecting the same report you are configuring and the field you want to use.
Example: If you are in Report1, and you have a field called Actor Name, you can connect actors with each other by adding a referenced field selecting Report1 as Data structure and Actor Name as Display Field. Then, activate Network Analysis and select a Data Structure to select available Link Labels.
If your Link Label is called Cooperation and you connect the field called Actor Name, in this example your Network will show links between the actors that are cooperating with each other.
You can also do it using multiple references, and this will allow you to connect one actor with many others at the same time.
Create relationships between nodes of different reports
If you want to use or create relationships between nodes of different reports, add a reference, connected reference, or multiple reference fields selecting the other report and the display field you want to connect it with.
Example: If you are in Report1, and you have a field called Actor Name, you can connect actors with another field in Report2 that contains Countries by adding a referenced field selecting Report 2 as Data structure and Country Name as Display Field. Then, activate Network Analysis and select a Data Structure for your Link Labels.
If your Link Label selection is called "Has lived in" and you connect the field called Actor Name to the Field Country, in this example your Network will show links between the actors and the countries where they have lived in. You can also do it using multiple references, and this will allow you to connect one actor with more than one country.
Additionally, your report could have a Connected Reference that is used to filter options based on a previous reference field selection (e.g. Region + Country, countries options are filtered to the region previously selected). In this case, you could create an additional link connecting Actors to their respective countries based on the region they lived in.
Now that everything is set up, go to your created Report Structure and start adding data manually or using our bulk upload feature.
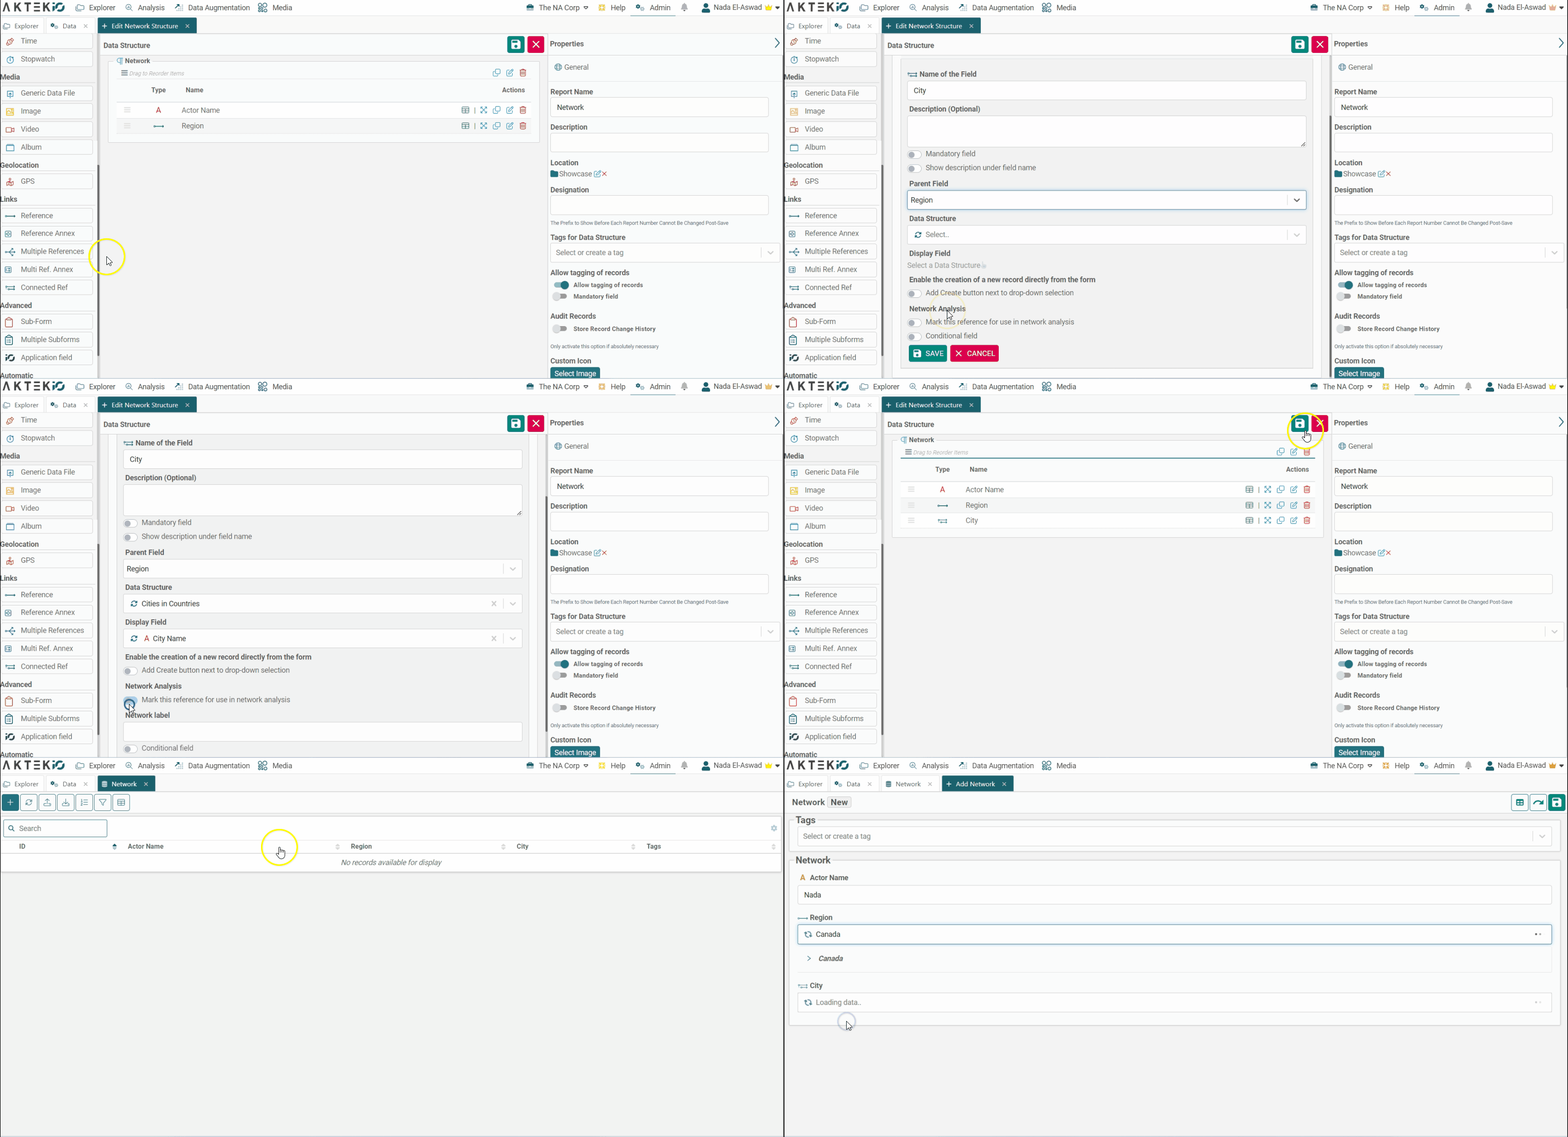
✅ Your report can have multiple Reference Fields. This means that one report can have multiple Network Links, inside the same reports or with others.
✅ Bulk upload only supports the Reference Field, but is not available for Multiple or Connected references.
Fields to create powerful Networks
Color fields: node categories
If you want to categorize your Nodes using colors, you can either do so manually directly in Network Settings or use the Color field for key databases that will work as categorizations.
Following our example above in which Actors are connected (linked) to each other and connected to Countries and Cities, you could use fields like Countries or Cities to create color categories for your actors.
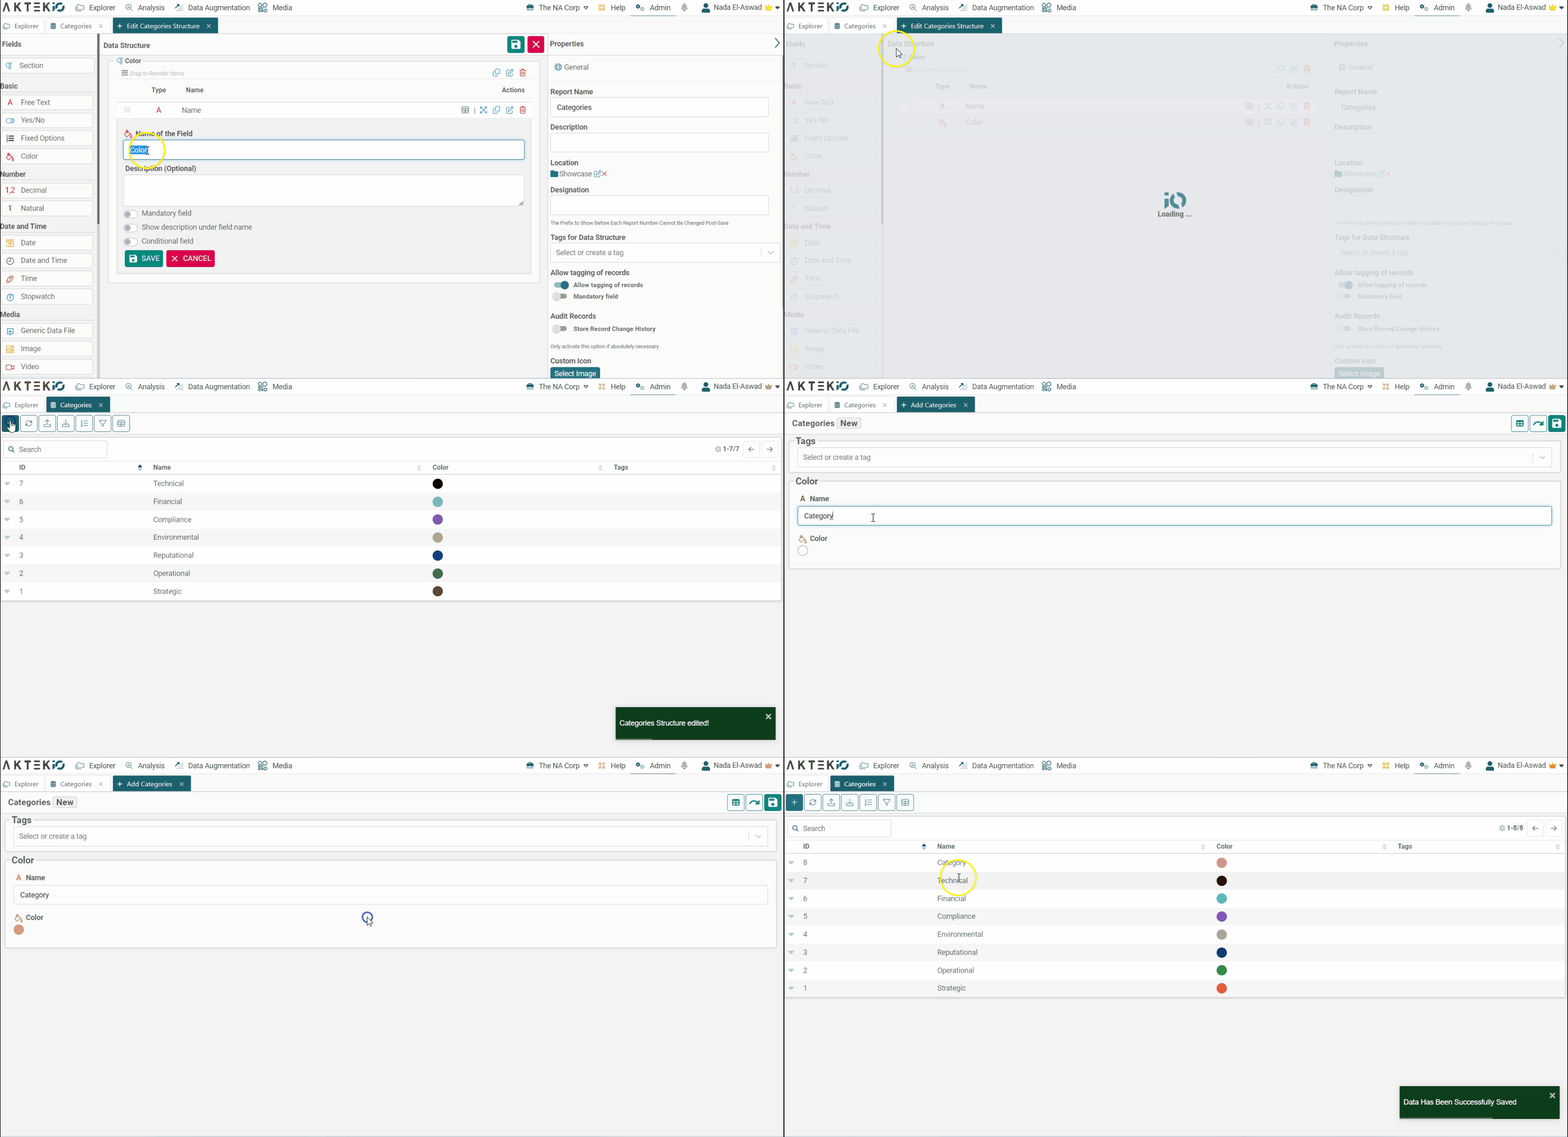
- To do so, go to the main table you are referencing to with Edit from Data Structure and add a Color Field. This will allow you to later create color categories for your actors based on the Country they live in.
-
Complete the data in your main report to add the colors to each of the entries. In the example above, Actors are linked to Countries. This will later allow you to use Countries to define colors for your Nodes. You could do this with any relevant field for your analysis.
Quantitative Fields: Node sizing and gradients
- If you want to be able to change the size of your Nodes based on a variable other than the number of connections attached to each one, go to Data Structure and click on Edit the report you will use to build your Network.
-
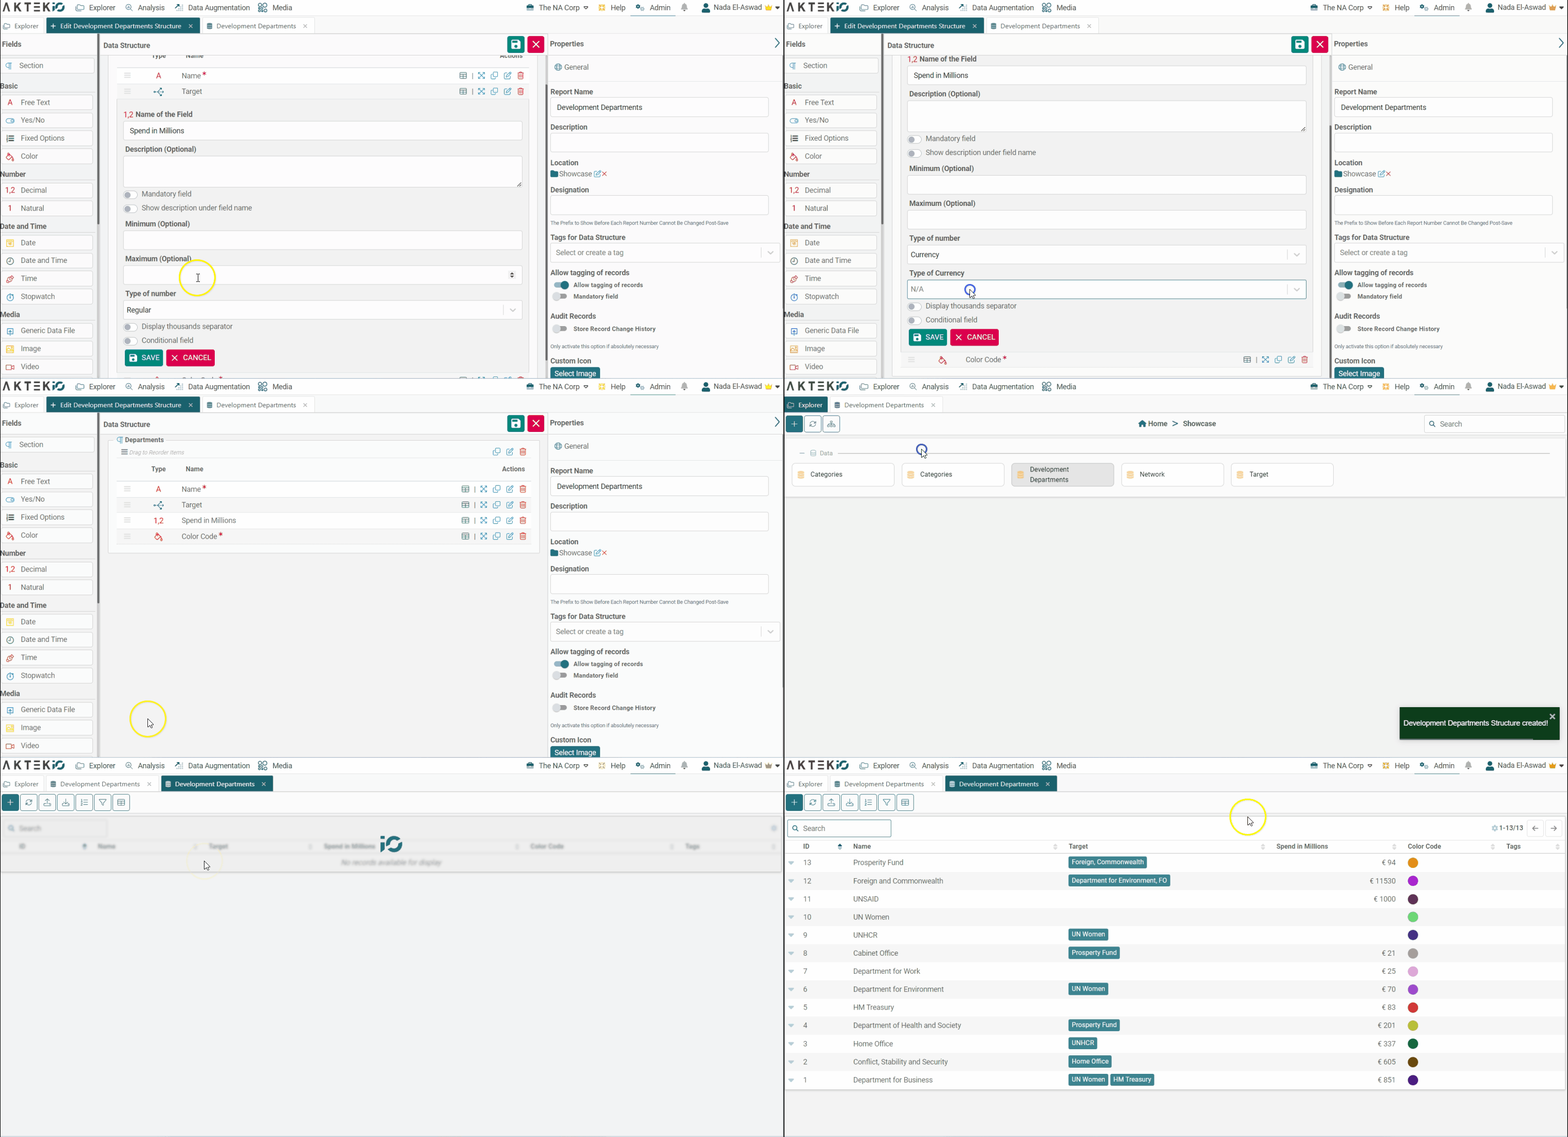
Add any Numerical Field to your report, you will need to have at least one Numerical field in order to use it as a variable for the size of your Nodes.
This is how the size of your nodes could vary:

-
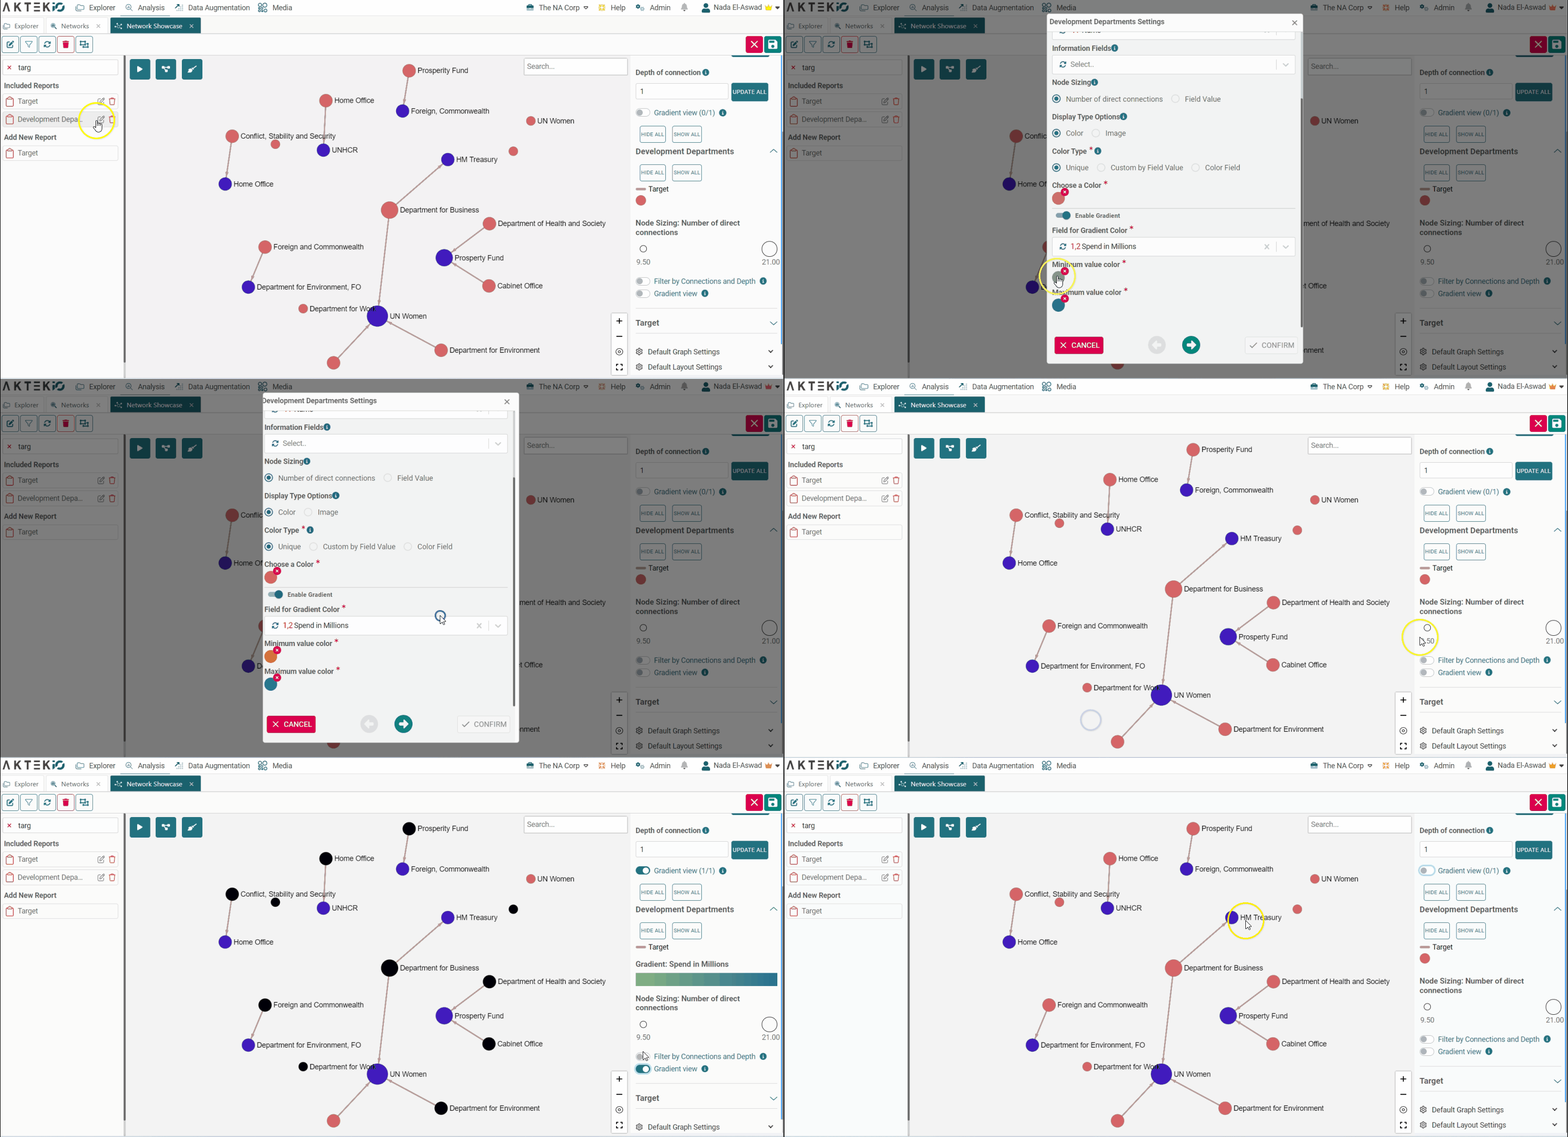
You could also use your numerical values to create an alternative way of looking at your Nodes. This is what you will find in your settings options as Gradient.
Gradients will allow you to have a secondary view of your nodes' colors, on-demand, based on a different color code tied to a quantitative variable such as Age or Spend in millions (instead of simply showing node categories).
This is how a Gradient will appear in your Network:

✅ Make sure all your relevant fields on your data structure have the option Force the user to fill in this field enabled, this way all of your nodes will have the information they require to change according to your settings.
💡 To use your data to create graphs with analytical value, visit our Create a Network page.
